

Load Balancing, Health Checks and Session Affinity in YARP
In YARP, PowerOfTwoChoices and LeastRequests shift traffic away from a slow instance on their own; passive health checks only count transport errors and the reactivation period can't be shorter than the 60 second window, so use them with active checks. On three Catalog instances we measure the policies, write a zone-aware policy, and show HealthyOrPanic, HashCookie affinity, service discovery, and HTTP/2 and ActivityTimeout pitfalls with real logs.
Version note: The code in this post was built and run with .NET 10, Yarp.ReverseProxy 2.3 and Microsoft.Extensions.ServiceDiscovery.Yarp 10.11.
Guess First
The Catalog service has three instances, and one of them, catalog-2, answers every request with a 50 ms delay. You send 600 requests to the gateway over 20 parallel connections. If the load balancing policy were RoundRobin, how many requests would catalog-2 get? With PowerOfTwoChoices?
Second question: passive health checks are on for the cluster, and you set ReactivationPeriod to 00:00:10. You kill catalog-2, the gateway takes it out, then you restart the process right away. After how many seconds does the gateway send traffic to catalog-2 again? Both answers were measured, and the second one isn't the number you'd guess from reading the YARP documentation.
Three Catalog Instances and a Small Measuring Tool
So far every cluster in the gateway we built for Bookstore, the online bookstore used as the shared example across this site's series, had a single destination. We scale the Catalog service to three instances. To see which instance answered, Catalog adds an X-Catalog-Instance header to every response, and it reads a delay from config to simulate a slow instance:
app.Use(async (context, next) =>
{
    context.Response.Headers[InstanceInfo.Header] = instance.Name;
    if (instance.ResponseDelayMs > 0 && context.Request.Path.StartsWithSegments("/books"))
    {
        await Task.Delay(instance.ResponseDelayMs, context.RequestAborted);
    }
    await next();
});

app.MapHealthChecks("/health");
The instance name and port come from three profiles in launchSettings.json (http, catalog-2, catalog-3; ports 5301, 5311, 5312). The gateway's cluster definition now has three destinations:
dotnet run --project src/Bookstore.Catalog.Api
dotnet run --project src/Bookstore.Catalog.Api --launch-profile catalog-2
dotnet run --project src/Bookstore.Catalog.Api --launch-profile catalog-3
"catalog": {
"LoadBalancingPolicy": "PreferSameZone",
"HealthCheck": {
"AvailableDestinationsPolicy": "HealthyOrPanic",
"Active": {
"Enabled": true,
"Interval": "00:00:05",
"Timeout": "00:00:02",
"Policy": "ConsecutiveFailures",
"Path": "/health"
},
"Passive": {
"Enabled": true,
"Policy": "TransportFailureRate",
"ReactivationPeriod": "00:01:00"
}
},
"HttpRequest": {
"ActivityTimeout": "00:00:30"
},
"Metadata": {
"ConsecutiveFailuresHealthPolicy.Threshold": "2",
"TransportFailureRateHealthPolicy.RateLimit": "0.5"
},
"Destinations": {
"catalog-1": { "Address": "http://localhost:5301/", "Metadata": { "Zone": "zone-a" } },
"catalog-2": { "Address": "http://localhost:5311/", "Metadata": { "Zone": "zone-a" } },
"catalog-3": { "Address": "http://localhost:5312/", "Metadata": { "Zone": "zone-b" } }
}
}We'll unpack every line of this config throughout the post. To measure the distribution I added a small console app to the repo, tools/Bookstore.LoadProbe: it sends requests to a URL with a given parallelism and counts the responses by the X-Catalog-Instance header and status code. The same command works on Windows:
dotnet run --project tools/Bookstore.LoadProbe -- http://localhost:5300/api/v1/books 600 20Load Balancing Policies: Comparing by Measurement
YARP ships with five built-in policies, and if you don't set one, PowerOfTwoChoices is used. I started catalog-2 with a 50 ms delay and changed the cluster's LoadBalancingPolicy four times while the gateway was running (thanks to the live reload from post 02, without restarting the gateway). Each run is 600 requests over 20 parallel connections:
| Policy | catalog-1 | catalog-2 (slow) | catalog-3 | Total time | p95 |
|---|---|---|---|---|---|
RoundRobin | 200 | 200 | 200 | 1.1 s | 53 ms |
Random | 207 | 209 | 184 | 1.1 s | 53 ms |
PowerOfTwoChoices | 305 | 5 | 290 | 0.1 s | 1 ms |
LeastRequests | 336 | 4 | 260 | 0.1 s | 0 ms |
The answer to the first "Guess First" question is in the table: RoundRobin gives the slow instance a full third, and the p95 latency sticks to that instance's delay. PowerOfTwoChoices picks two random destinations and takes the one with fewer concurrent requests at that moment; LeastRequests looks at all destinations and picks the one with the fewest concurrent requests. Because requests stay "open" longer on the slow instance, both naturally pick it rarely. The difference between them is scale: LeastRequests scans the whole list on every request, PowerOfTwoChoices only looks at two, and in large clusters it also reduces the chance of every gateway instance piling onto the same "emptiest" destination. That's why it makes sense as the default. The fifth policy, FirstAlphabetical, picks the healthy destination whose ID comes first alphabetically; it isn't load distribution, it's for active-passive failover.
A caveat: these numbers come from a single machine, over localhost, with a very small payload. Your numbers will differ; what the table shows isn't the absolute values but how each policy reacts to a slow destination.
Your Own Load Balancing Policy: Preferring the Same Zone
The built-in policies don't know where destinations live. Say Bookstore's instances are spread over two zones: the gateway is in zone-a, as are catalog-1 and catalog-2, while catalog-3 is in zone-b. Cross-zone traffic means both latency and a cloud bill. What we want: if there are healthy destinations in the same zone, pick among them; if none are left, move to the other zone. ILoadBalancingPolicy is a single method:
public sealed class PreferSameZonePolicy(IConfiguration configuration) : ILoadBalancingPolicy
{
    public const string PolicyName = "PreferSameZone";
    public const string ZoneMetadataKey = "Zone";

    private readonly string? _zone = configuration["Gateway:Zone"];

    public string Name => PolicyName;

    public DestinationState? PickDestination(
        HttpContext context, ClusterState cluster, IReadOnlyList<DestinationState> availableDestinations)
    {
        if (availableDestinations.Count == 0)
        {
            return null;
        }

        List<DestinationState> local = [];
        foreach (DestinationState destination in availableDestinations)
        {
            if (destination.Model.Config.Metadata?.GetValueOrDefault(ZoneMetadataKey) == _zone)
            {
                local.Add(destination);
            }
        }

        IReadOnlyList<DestinationState> candidates = local.Count > 0 ? local : availableDestinations;
        if (candidates.Count == 1)
        {
            return candidates[0];
        }

        // like PowerOfTwoChoices: two random candidates, the one with fewer concurrent requests wins
        int first = Random.Shared.Next(candidates.Count);
        int second = Random.Shared.Next(candidates.Count - 1);
        if (second >= first)
        {
            second++;
        }

        DestinationState a = candidates[first];
        DestinationState b = candidates[second];
        return a.ConcurrentRequestCount <= b.ConcurrentRequestCount ? a : b;
    }
}

// Program.cs
builder.Services.AddSingleton<ILoadBalancingPolicy, PreferSameZonePolicy>();
The policy is registered in the DI container as a singleton and selected in the cluster config by its Name. The key point: availableDestinations is the list left after health checks. So the policy doesn't deal with health at all; "nobody left in the same zone" is a natural consequence of health checking. 600 requests without any delay:
600 requests, concurrency 20, 0.1 s
p50 0 ms, p95 1 ms
  catalog-1      296
  catalog-2      304
  status 200     600
catalog-3 got no requests. This method runs on every request; it must not do I/O, take locks or do expensive computation. Here we allocate a small List, which is negligible for three destinations; in a cluster with hundreds of destinations it would be better to precompute the zone lists.
Active and Passive Health Checks
Active: periodic probes
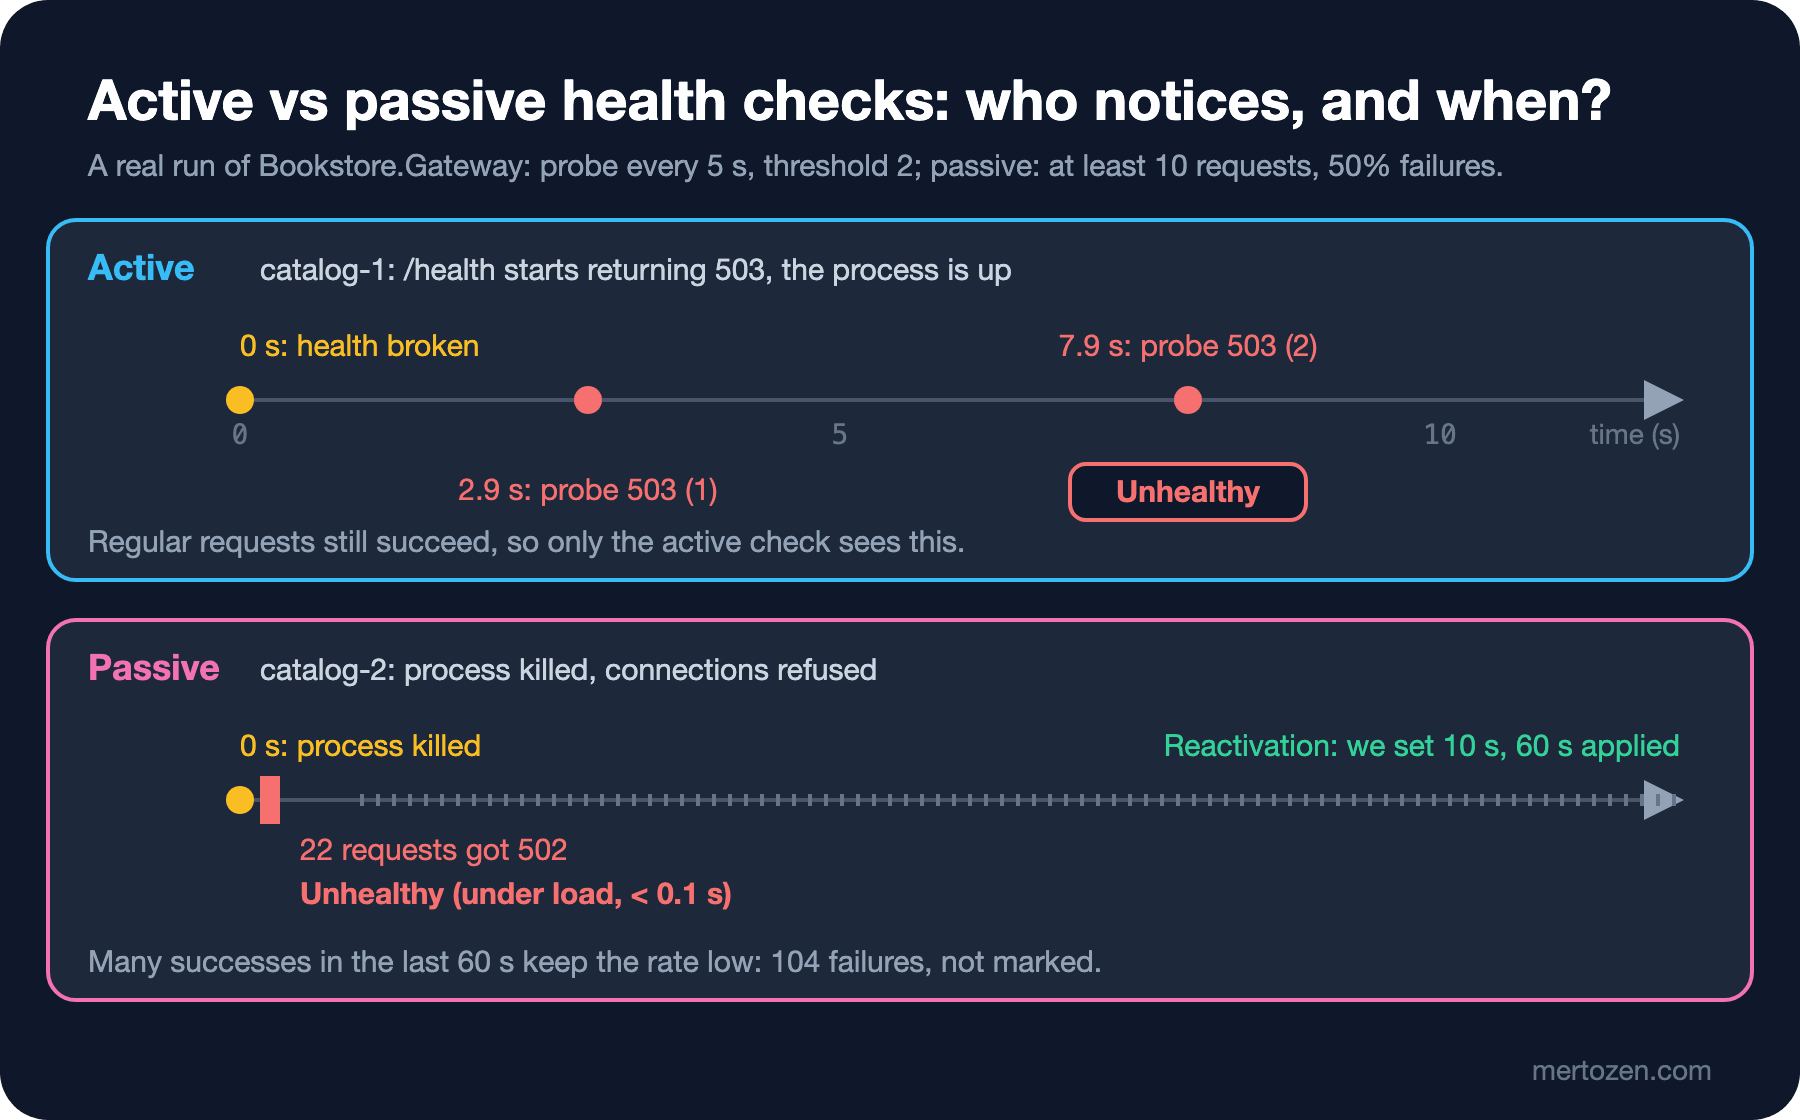
An active health check means the gateway itself sends requests to each destination at intervals. In our config, /health is called every 5 seconds, a probe fails if no answer arrives within 2 seconds, and the ConsecutiveFailures policy marks the destination Unhealthy after 2 failed probes in a row (the threshold is ConsecutiveFailuresHealthPolicy.Threshold in metadata; the default is 2 as well). YARP's default interval is 15 seconds and its timeout 10 seconds. We covered how to write the /health endpoint and the liveness vs readiness split in the Health Check post of the ASP.NET Core Web API series; what's right for a gateway is readiness, the answer to "is this instance ready to take traffic".
I added an endpoint to Catalog, available only in Development, that breaks the health check without killing the process. I broke catalog-1's health at 13:47:02.3; the gateway log:
13:47:05.193 info: Yarp.ReverseProxy.Health.ActiveHealthCheckMonitor[16]
      Probing destination `catalog-1[localhost:5301]` on cluster `catalog` completed with the response code `503`.
13:47:10.198 info: Yarp.ReverseProxy.Health.ActiveHealthCheckMonitor[16]
      Probing destination `catalog-1[localhost:5301]` on cluster `catalog` completed with the response code `503`.
13:47:10.201 warn: Yarp.ReverseProxy.Health.DestinationHealthUpdater[49]
      Active health state of destination `catalog-1[localhost:5301]` on cluster `catalog` is set to 'Unhealthy'.
About 8 seconds later catalog-1 was taken out, and all of the next 600 requests went to catalog-2. In this case normal requests to catalog-1 were still succeeding; only the active check could see this. An instance that has lost its database connection but still serves the book list from cache looks exactly like this.
Passive: watching real traffic
A passive health check doesn't send any extra requests; it looks at the outcome of proxied requests. The TransportFailureRate policy computes the failure rate of requests to a destination over the last 60 seconds and takes the destination out when the rate exceeds the limit. "Failure" here doesn't mean 5xx. The cases counted in YARP's source code are transport errors such as failing to connect, timeouts and the body breaking on the backend side; a 500 the backend returns on purpose doesn't count. Evaluation needs at least 10 requests in the window, and the limit is 30% by default; we set it to 50% in metadata.
To measure cleanly, I turned off the active check, restarted the gateway (to reset its history), killed catalog-2 and immediately sent 600 requests:
600 requests, concurrency 20, 0.1 s
p50 0 ms, p95 1 ms
  (none)          22
  catalog-1      578
  status 200     578
  status 502      22

warn: Yarp.ReverseProxy.Health.DestinationHealthUpdater[19]
      Destination `catalog-2[localhost:5311]` marked as 'Unhealthy` by the passive health check is scheduled for a reactivation in `00:01:00`.
22 requests got 502, then catalog-2 was taken out. The active check would have seen this within 5 to 10 seconds; under load the passive check is much faster. But when I repeated the same experiment a few seconds after the gateway had sent 600 successful requests to catalog-2, the result was different: 104 requests got 502 and the passive check never marked catalog-2. Because the rate is computed over all requests in the last 60 seconds, 104 failures next to 600 successes didn't reach 50%. A busy instance dying suddenly is exactly this case, so don't rely on passive checks alone; use them together with active checks.
The answer to the second "Guess First" question is in the log too: even when I lowered ReactivationPeriod to 10 seconds, the log said reactivation in 00:01:00, and the restarted catalog-2 got its first traffic after 60 seconds. In YARP's source code, the reactivation period can't be shorter than the policy's DetectionWindowSize of 60 seconds; the goal is to keep old failure history from affecting the new evaluation. If you want a shorter period, you need to shrink the window through TransportFailureRateHealthPolicyOptions.
When everything is unhealthy: HealthyOrPanic
I broke the health of all three instances at once. Since YARP 2.1 the default AvailableDestinationsPolicy is HealthyOrPanic: when no healthy destination is left, it goes into "panic" mode and treats all of them as available. Then I switched the policy to HealthyAndUnknown:
== HealthyOrPanic
  catalog-1      162
  catalog-2      138
  status 200     300
      Route catalog-v1 -> cluster catalog, 3 available destination(s)
== HealthyAndUnknown
  (none)         300
  status 503     300
      Route catalog-v1 -> cluster catalog, 0 available destination(s)
warn: Yarp.ReverseProxy.LoadBalancing.LoadBalancingMiddleware[7]
      No available destinations after load balancing for cluster 'catalog'.
Which one is right depends on how much you trust your health endpoint. If the health check itself is broken (a wrong path, a slow dependency check), HealthyOrPanic keeps the site up. If you trust the health check and sending requests to a broken instance can cause data errors, a fast and explicit 503 with HealthyAndUnknown is better.
Session Affinity: When Do You Need It?
Session affinity means always sending the same client's requests to the same destination. In YARP it's enabled per cluster; since 2.0 the default policy is HashCookie:
"SessionAffinity": {
  "Enabled": true,
  "Policy": "HashCookie",
  "FailurePolicy": "Redistribute",
  "AffinityKeyName": ".Bookstore.Catalog.Affinity",
  "Cookie": {
    "HttpOnly": true,
    "SameSite": "Lax",
    "SecurePolicy": "SameAsRequest"
  }
}
Set-Cookie: .Bookstore.Catalog.Affinity=d673564b930708ae; path=/; samesite=lax; httponly
X-Catalog-Instance: catalog-2
X-Catalog-Instance: catalog-2
X-Catalog-Instance: catalog-2The first response set the cookie, and every subsequent request went to catalog-2. The cookie value is a hash of the destination ID. ArrCookie does the same in the cookie format of IIS's ARR module, which helps when migrating off an old IIS setup. The documentation states clearly that neither cookie gives strong privacy and that you shouldn't put sensitive data in destination IDs. Then I killed catalog-2:
HTTP/1.1 502 Bad Gateway
# 12 s later:
HTTP/1.1 200 OK
Set-Cookie: .Bookstore.Catalog.Affinity=e76da95c600cb57c; path=/; samesite=lax; httponly
X-Catalog-Instance: catalog-1

warn: Yarp.ReverseProxy.SessionAffinity.HashCookieSessionAffinityPolicy[39]
      Destination matching to the request affinity key is not found on cluster `catalog`. Configured failure policy will be applied.
Until the health check marked the destination, affinity kept sending the request to the dead instance. Once it was marked, the Redistribute policy gave the request to another destination and renewed the cookie. Whatever state the user had in that instance's memory was gone; affinity is a preference, not a guarantee.
That's why we keep affinity off for Bookstore's Catalog; it isn't in the snapshot's config. The places that really need it are limited: SignalR's non-WebSocket transports (long polling, server-sent events) must stick to the same server for the whole connection; we discussed that in the Real-time Applications series post on scaling out SignalR. Keeping an old app that holds session state in memory alive during a migration is another reason (we'll see it with the strangler fig in post 06). Beyond those, the right fix is to move state to a shared place (Redis, a database) and keep the service stateless.
Discovering Destinations Dynamically
Writing addresses into config by hand is fine for three fixed instances, not when the instance count changes. IDestinationResolver, introduced in YARP 2.1, is an extension point that expands the destinations in config into real addresses. YARP has a DNS resolver of its own (AddDnsDestinationResolver): it resolves the host name, creates a destination for each IP, and refreshes every 5 minutes by default. In Bookstore we use the YARP integration of the Microsoft.Extensions.ServiceDiscovery library; on the day I wrote this, 11.0.0 is also on NuGet, but we picked 10.11.0 to match the .NET 10 base. The Ordering cluster now uses a logical name instead of an address:
// Program.cs
builder.Services.AddServiceDiscovery();

builder.Services.AddReverseProxy()
    .LoadFromConfig(builder.Configuration.GetSection("ReverseProxy"))
    .AddTransforms(InternalHeaderTransforms.Apply)
    .AddConfigFilter<DestinationAddressFilter>()
    .AddServiceDiscoveryDestinationResolver();

// appsettings.json
"Services": {
  "ordering": {
    "http": [ "localhost:5302" ]
  }
},
"ReverseProxy": {
  "Clusters": {
    "ordering": {
      "Destinations": {
        "ordering": { "Address": "http://ordering" }
      }
    }
  }
}
curl http://localhost:5300/api/v1/orders/1001
{"id":1001,"customerEmail":"ada@example.com","total":605.50,"status":"Shipped"}
Forwarded to ordering[localhost:5302], status 200The resolver resolved http://ordering using the Services:ordering:http list in configuration and turned the destination ID into ordering[localhost:5302]. In development the list comes from config; on Kubernetes or Azure Container Apps the same code works with the pass-through provider that falls back to the platform's DNS. We covered client-side vs server-side discovery in the Service Discovery post of the Microservices series. Aspire fills these addresses in automatically; we leave that side to the upcoming Distributed Apps with Aspire series.
The Cluster's HttpClient and HttpRequest Settings
Each cluster talks to its backends through its own HttpMessageInvoker. The connection side lives in the HttpClient section (MaxConnectionsPerServer, EnableMultipleHttp2Connections, SslProtocols, DangerousAcceptAnyServerCertificate), the request side in the HttpRequest section (ActivityTimeout, Version, VersionPolicy). Three settings cause real trouble.
ActivityTimeout: in YARP's source code its default is 100 seconds. It isn't a total duration; it's the longest time that may pass without any data from the backend. I lowered it to 2 seconds and started catalog-2 with a 3 second delay:
40 requests, concurrency 4, 2.0 s
p50 0 ms, p95 2023 ms
  (none)           2
  catalog-1       38
  status 200      38
  status 504       2

warn: Yarp.ReverseProxy.Forwarder.HttpForwarder[48]
      RequestTimedOut: The request timed out before receiving a response.
Two requests got 504 Gateway Timeout. Careful: RequestTimedOut is one of the error kinds the passive health check counts as a failure. With a short ActivityTimeout, a slow but sound instance can be taken out by the passive check. For a total time limit per route we'll use the request timeouts middleware in post 04.
HTTP version: in post 01 the log said HTTP/2 RequestVersionOrLower but Received HTTP/1.1. Using HTTP/2 over an unencrypted connection requires both sides to agree explicitly. I started catalog-1 accepting only HTTP/2 (--Kestrel:EndpointDefaults:Protocols=Http2) and gave the cluster "Version": "2" and "VersionPolicy": "RequestVersionExact":
      Proxying to http://localhost:5301/books HTTP/2 RequestVersionExact
      Received HTTP/2.0 response 200.

      Probing destination `catalog-2[localhost:5311]` on cluster `catalog` failed.
      System.Net.Http.HttpRequestException: The HTTP/2 server closed the connection. HTTP/2 error code 'HTTP_1_1_REQUIRED' (0xd). (HttpProtocolError)
catalog-1 now speaks HTTP/2. catalog-2 and catalog-3, on the default Kestrel settings, refused unencrypted HTTP/2; since health probes use the same HttpRequest settings, both became Unhealthy and all traffic stayed on catalog-1. Change the version setting together with every destination in the cluster. This is why proxying gRPC needs HTTP/2 end to end; we'll come back to it in post 04.
DangerousAcceptAnyServerCertificate: not validating the backend's TLS certificate at all. It's tempting in local development to avoid dealing with self-signed certificates, but if this setting leaks into production config, TLS between the gateway and the backend becomes meaningless. Keep it only in appsettings.Development.json; in production get the backend certificate from a trusted CA, or add your internal CA to the gateway's trust store.
Production Notes
Account for the cost of the health endpoint. Every gateway instance sends its own probes to every destination: 4 gateways, 20 destinations and a 5 second interval means 16 health requests per second. If /health queries the database, that load reaches the database too; keep the readiness check light.
Health state is kept per gateway instance. Two gateway instances can disagree about the same destination for a while, and passive check history is per instance too. Instead of expecting consistent behavior, accept that each instance decides on its own observations, and collect logs with the instance name.
Alert on health state changes (is set to 'Unhealthy', marked as 'Unhealthy'). The gateway quietly taking out an instance is good; nobody noticing is bad, because your capacity just shrank.
Common Pitfalls
First, assuming passive health checks count 5xx responses. They don't; when the app starts returning errors, the destination keeps looking healthy. App-level problems have to be caught by the active check's readiness endpoint.
Second, expecting an instance to come back quickly after you shorten ReactivationPeriod. The value can't be shorter than the detection window, 60 seconds by default.
Third, using the MapReverseProxy overload and forgetting UsePassiveHealthChecks() or UseSessionAffinity(). A feature that looks enabled in config won't work; that's why those lines are in our pipeline from post 01.
Fourth, treating session affinity as the fix for a state problem. When an instance dies, restarts during a deployment, or the cluster scales in, the user's state is lost anyway; affinity only postpones that moment.
Fifth, doing slow work in a custom load balancing policy. PickDestination runs on every request, on the request's critical path.
A Small Experiment
★☆☆ Start catalog-2 with a 50 ms delay and send 600 requests with the FirstAlphabetical policy. Then break catalog-1's health and repeat the measurement. Use the result to explain why this policy works for active-passive failover.
★★☆ Configure TransportFailureRateHealthPolicyOptions in Program.cs and lower DetectionWindowSize to 15 seconds. Leave ReactivationPeriod at 10 seconds, kill catalog-2, restart it, and look at the reactivation period in the log. Explain the value you see with the rule in the source code.
★★★ Add a spillover rule to PreferSameZonePolicy: if both candidates in the same zone have a ConcurrentRequestCount above a threshold you define in metadata, destinations in the other zone become candidates too. Start catalog-1 and catalog-2 with a 50 ms delay, run LoadProbe with 5, 20 and 50 parallel connections, and measure at what load catalog-3 starts getting traffic.
Traffic is now spread across multiple instances in a healthy way. In the next post we put the first real cross-cutting work into the gateway: JWT validation, per-route authorization, per-user rate limiting, timeouts and output caching, plus how to carry identity to the backend safely.