

Story Mapping and Splitting Stories: Walking Skeleton, Vertical Slices and Choosing the First Release

A story map arranges stories left to right by the user's flow and top to bottom by priority, exposing the gaps a flat backlog hides and anchoring the first release on an end-to-end walking skeleton. We draw Bookstore's institutional order map, choose the skeleton and release slices, split large stories by rules, data, exceptions, workflow steps, manual-first and spikes, and explain why splitting by layer is a bad idea.
Version note: This post is conceptual; story mapping follows Jeff Patton's article "The New User Story Backlog is a Map" (2008) and his book "User Story Mapping" (2014), and the walking skeleton follows Alistair Cockburn's description.
Guess First
In the previous post we derived seven stories from the institutional order use case. Selin put them, together with a few ideas left over from elicitation, into an ordered backlog: thirteen rows, the most important at the top. The calendar is fixed: three sprints until September 1.
Emre and Ayşe propose a plan: "In the first sprint we build all the tables and entities, in the second the API endpoints, in the third the Angular screens. That way we do each layer once, properly."
Two questions. What can you show Ms. Nevin at the end of the first sprint? If, in the middle of the third sprint, it turns out the ERP integration takes twice as long as expected, what will you have on September 1?
The Problem with a Flat Backlog
An ordered backlog answers one question well: what's next? But it doesn't answer another question at all: what does this system do as a whole, and what did we forget? In his 2008 article Jeff Patton describes this problem as stories losing their context once they are lined up in order. Someone looking at the thirteen-row list cannot see the purchasing officer's journey; which story belongs to which step, and which step has no story at all, is invisible in the list.
Bookstore's list is a good example. The use case started with "the purchasing officer starts a new order with the institution's account"; how the institution's account gets created was in no story. The invoice was to be transferred to the ERP, but who would do the transfer, and how, was missing too. The list was ordered but incomplete, and its being ordered hid the gap.
Anatomy of a Story Map
A story map lays the same stories out on a two-dimensional surface. The horizontal axis is the narrative of how the user does the work from start to finish: read left to right, it tells a story. The top row holds the user activities; Patton calls this row the backbone. Activities are pieces of work too large to fit in one story, such as "building the book list". Below each activity sit the steps that make it up and the stories that implement those steps.
The vertical axis is priority: under an activity, a story higher up is more important than one lower down. Patton stresses a subtle point: the activities in the backbone are not prioritized against each other, because the system needs all of them to work. What gets prioritized are the stories beneath them.
The Bookstore team builds the map in a workshop, on a wall. The best way to write the backbone is to retell last September's story Ms. Nevin described in the interview from the earlier posts: first the institution account, then the list, then the review, then approval and submission, finally delivery and payment. Five activities come out. Then the existing stories are stuck under the relevant activity, and the columns left empty jump out immediately.
The Institutional Order Story Map
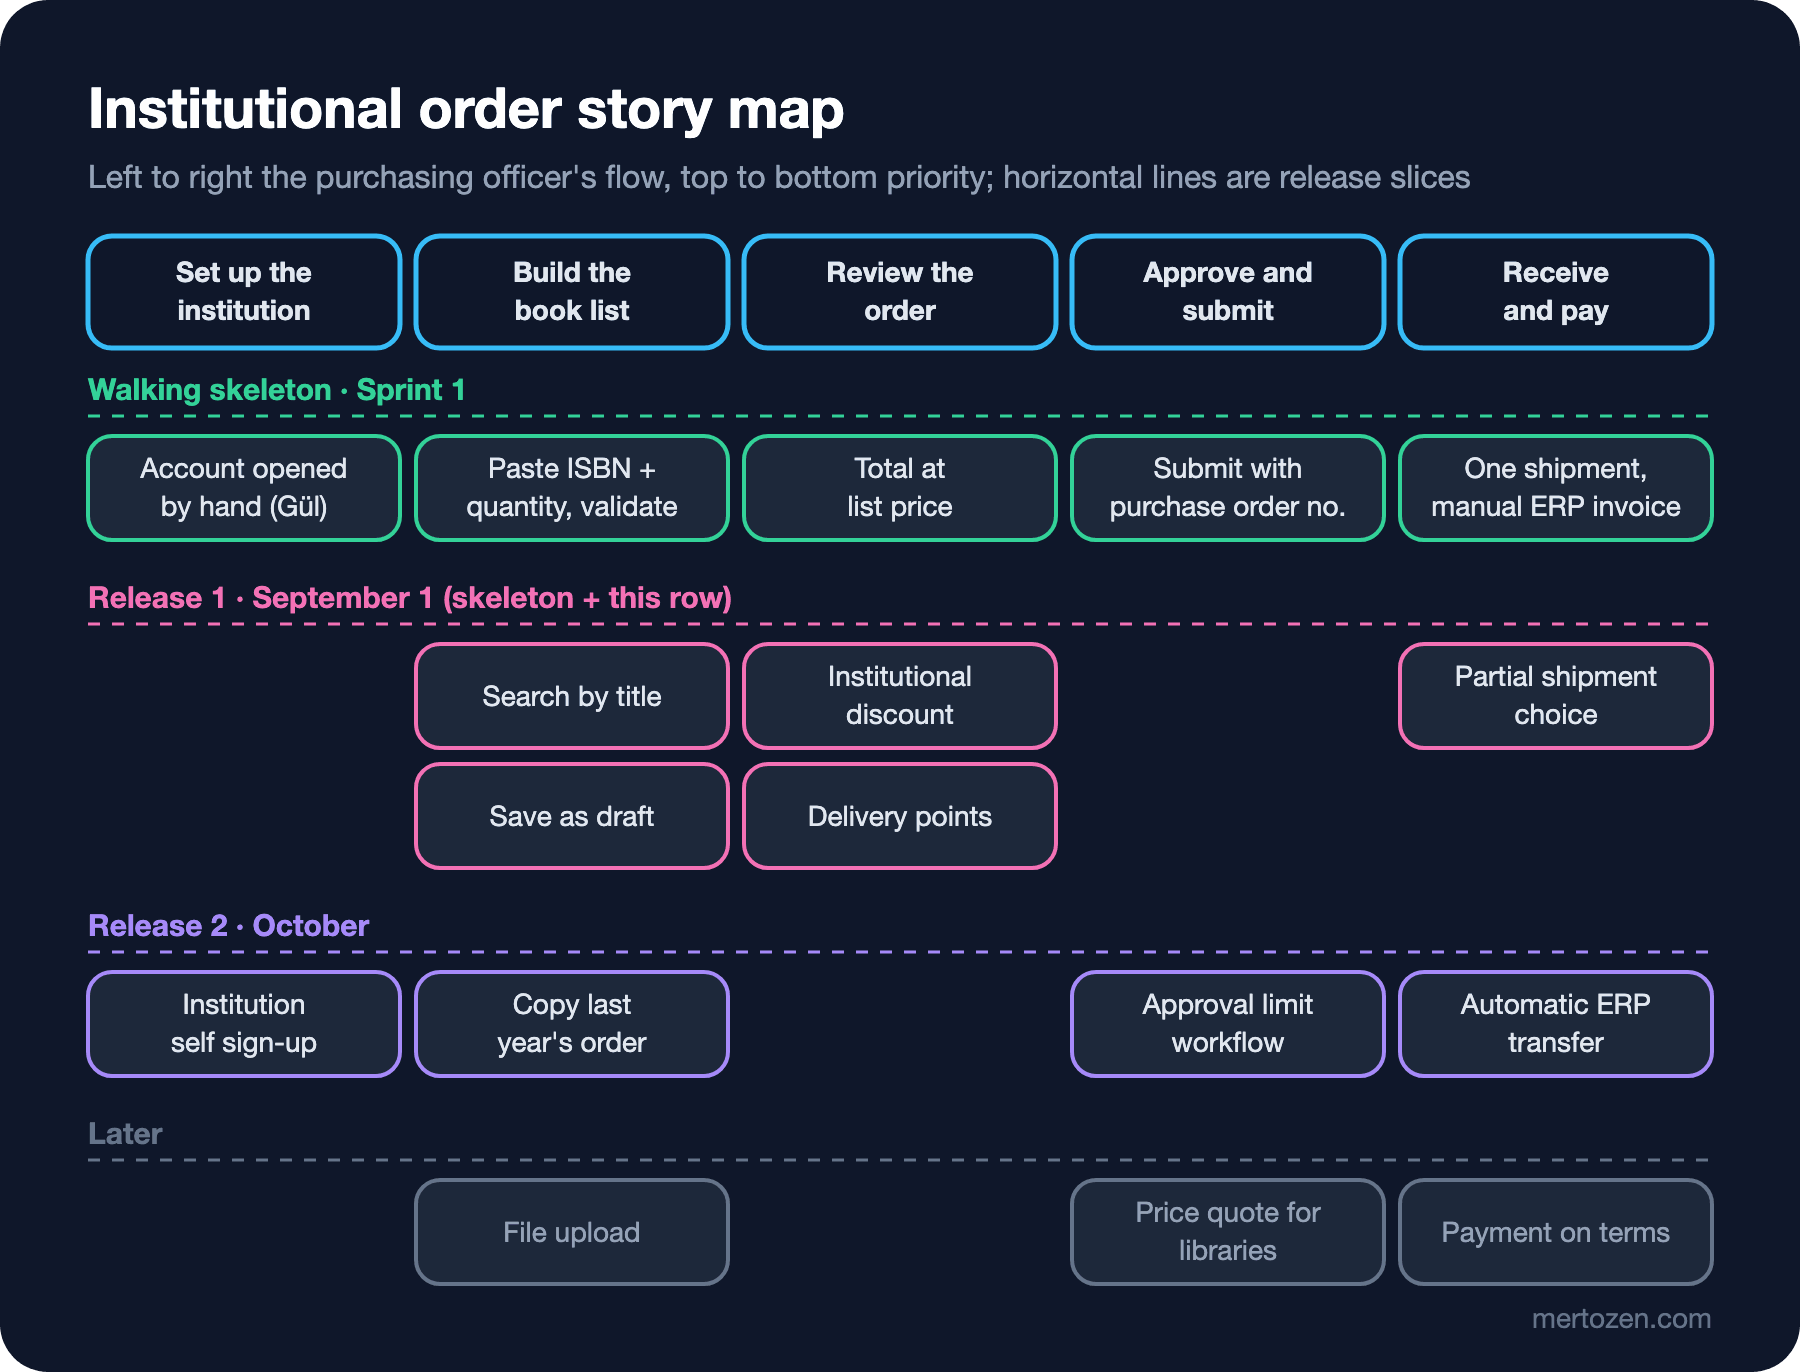
The map's first benefit is that the gaps from the flat backlog section become visible. There was no story from the use case under the "Set up the institution" and "Receive and pay" columns. The team writes new cards for these columns: who opens the institution account, how the invoice reaches the ERP. Without these cards there would be a working screen on September 1, but Bookstore could not process a single institutional order from start to finish.
The second benefit is that the conversation changes. On a flat list the debate "partial shipment first or delivery points first?" happens between two cards. On the map the question becomes: will the purchasing officer be able to make this journey from start to finish in September, and at which step will she struggle most? The information from interviews and document analysis drives the decision here: 15 of the 46 lists had no ISBNs, so "Search by title" is in the first release; Ms. Nevin's school has three campuses, so "Delivery points" is too.
Walking Skeleton and the First Release
The walking skeleton is an idea Alistair Cockburn named and Patton carried over to story maps: the thinnest first version that connects the main parts of the system end to end and can do a small piece of work from start to finish. The skeleton doesn't have to be pretty, but it has to walk. On the map this means the topmost horizontal slice that takes at least one card from under every activity.
Bookstore's skeleton is the green row in the figure. Gül from customer service opens institution accounts by hand; the purchasing officer pastes the list of ISBNs and quantities and sees the validation result; the total is calculated at list price; the order is submitted with the purchase order number; the warehouse makes a single shipment and the invoice is entered into the ERP by hand every morning from a report. At the end of the first sprint this skeleton can process a real school's real order from start to finish, even if partly by hand.
The skeleton's two manual steps are a deliberate choice. Opening an institution account happens a few dozen times a year; leaving it to Gül instead of writing a screen for it in the first version frees the team's time for the steps the purchasing officer goes through every day. The ERP, on the other hand, is a system the team doesn't know at all; automatic transfer moves to the second release, and in the meantime the ERP's API is tried out in a two-day spike.
Release 1's scope is the skeleton plus the pink row. When choosing that row, the team argues priorities not with opinions but with the business requirement from the first post: halve customer service's manual order entry effort in September and bring wrong-book shipments close to zero. Without search by title and the institutional discount, some schools would still order by email and Gül would still type them in. Saving as a draft is a finding from the prototype test. The partial shipment choice comes from stock shortages being unavoidable in September.
The approval limit workflow drops to the second release. The answer to the open question asked of Ms. Nevin was decisive: internal school approval can be done by email in the first year. With a rough estimate the team believes the first slice fits into three sprints; if it doesn't, the bottom card of the pink row will drop to the second release. Estimation and planning themselves are the subject of the Estimation and Planning series.
Ways to Split a Large Story
Some cards on the map are too big to fit in a sprint. There are well-known resources for splitting stories; the story splitting guide Richard Lawrence published at Humanizing Work is one of the best known. Rather than memorizing a list, let's look at the axes along which Bookstore split its cards. They all share the same test: after splitting, does each piece give a user value on its own?
Splitting by rule variations. Behind the "Institutional discount" card are several rules: a single rate for all institutions, different rates for schools and libraries, a tiered discount that grows with quantity. The first piece starts with a single rate and covers schools' needs in September; the other rules come later as separate stories. Every piece shows a discounted total, so every piece gives value.
Splitting by data variations. The data format changes when entering the list: a 13-digit ISBN without dashes, an ISBN with dashes or an old 10-digit one, only a book title, an Excel file. The skeleton accepts the first two, "Search by title" adds the third, and file upload sits in the "Later" row and may never come; nobody looked for a file in the prototype.
Separating the happy path from the exceptions. The first piece of the "Delivery points" card is assigning each row to a single point; splitting the copies of one book across campuses is the second piece. The first piece gets most of Ms. Nevin's textbooks to the right campus; the second solves the remaining exception.
Splitting by workflow steps, but so that each step gives value. The library's price quote process is a big card. The first piece only produces the quote document: the library can start its internal approval with it, which is value on its own. The second piece creates an order from an approved quote in one click. Watch out: a split like "first the validation step, then the total step" fails this test, because validation on its own gives the user nothing.
Manual first, automatic later. The institution account and the ERP transfer in the skeleton are examples of this axis. Having a person do the first version of a step by hand shrinks the story and gets the end-to-end flow working early. The cost should be written down openly too: Gül will spend half an hour every morning entering invoices into the ERP, and that cost will set the priority of the automatic transfer.
Learning the unknown first. If the ERP transfer can't be estimated, a time-boxed spike comes first: two days, with its output defined up front: "A test invoice was transferred to the ERP's test environment; transfer time and failure modes were noted." The spike itself gives the user no value; its value is making the story behind it estimable and splittable. That is why the spike is kept separate from the story, and if it runs over its time box it is closed and discussed again.
Why Is Splitting by Layer Bad?
Back to the plan from Guess First: tables first, then the API, then the screens. In this plan there is nothing to show a user at the end of the first two sprints. Feedback from Ms. Nevin is only possible in the third sprint, and by then there is no time left to fix a misunderstanding. Integration risk also piles up at the end: the difficulty of the ERP transfer surfaces in the first sprint with the skeleton approach, and in the middle of the third sprint with the layer plan.
The layer plan is tempting because it matches the team's specializations and gives the feeling of doing each layer "once, properly". But designing a layer in one go without seeing the need usually means a design that will change later: if, while building the screens in the third sprint, the team realizes the delivery point belongs on the line rather than on the order, the first sprint's tables change.
Bill Wake reaches the same point in the 2003 article we used in the previous post, when explaining the Valuable quality: when splitting a story, cut vertically through the layers so that each piece gives the customer some value. A vertical slice means every story passes a thin piece through everything from the UI to the database. The "Search by title" story contains a search field, an endpoint and a catalog query; the three are delivered together.
This is the backlog counterpart of the idea we covered in the first post of the Vertical Slice Architecture series. There we saw that organizing code by feature rather than by layer gathers the files a change touches into a single folder. When you split the backlog into vertical slices, organizing the code into vertical slices becomes natural: a story usually touches one slice, sometimes a few. The two are independent decisions, but they reinforce each other.
In Production
A story map is not a document drawn once and archived. After each release, go back to the map: mark the finished cards, measure how close the release got to the business requirement (the number of orders Gül typed in by hand in September, the number of wrong books shipped) and reorder the lower slices based on what you learned. Moving the "Copy last year's order" card up in October should be a decision based on September's data.
Keep the map visible. A physical wall or a digital whiteboard, but somewhere the team and the Product Owner see every day. If the backlog order in the tracker and the slices on the map drift apart, decide as a team which one is the source of truth; two sources of truth are worse than none.
Manage the map's size. A map with hundreds of cards turns into wallpaper nobody can read. One map per epic is enough; detail below that lives in the cards themselves and in their acceptance conditions.
Common Pitfalls
The first pitfall is split stories that produce no value on their own. A story split into "Institutional order: backend" and "Institutional order: frontend" has not been split but cut into layers. For each piece ask "when this is done, who can do what?"; if the answer is "nobody yet", the split is wrong.
The second pitfall is drawing the map once and walking away. A map left on the wall after the first workshop no longer shows reality two sprints later: new cards are added to the tracker, not to the map, and the map's most valuable function, showing what is missing, is lost.
The third is fattening the skeleton. A conversation that starts with "let's put the institutional discount into the skeleton too, it's simple anyway" produces a half-finished release at the end of the first sprint instead of a walking skeleton. The skeleton's job is to take the thinnest card from each activity and prove that end-to-end works, not to please the user.
The fourth is leaving an activity out of the skeleton. A skeleton with an empty "Receive and pay" column takes orders on screen but produces orders that cannot be invoiced. Covering the whole backbone is the condition for the skeleton to walk.
The fifth is a spike without a time box. A spike opened as "investigate the ERP" with no defined output lasts a whole sprint and closes with "we need to investigate a bit more". Write the time box and the output when you open the spike.
A Small Experiment
★☆☆ Write the backbone for an epic you are working on: the four to six activities the user goes through to do the work from start to finish. Place the existing stories under these activities and find the activity with nothing underneath.
★★☆ On the same map, draw a walking skeleton slice: the thinnest card from each activity. Write down which steps you can accept doing by hand in the first version and what that costs.
★★★ Split the largest story in your backlog along at least two of the axes in this post. For each piece answer "when this is done, who can do what?"; merge any piece without an answer into another.
The stories of the first release are set and its boundaries are drawn. But the rules behind the "Institutional discount" and "Partial shipment choice" cards are still full of open questions: what does a minimum of 20 copies mean, when does the discount apply, what exactly happens when stock is insufficient? In the next post we take on acceptance criteria and Example Mapping and clarify these rules with concrete examples.