

SLO-Based Alerting: Burn Rate, Multiwindow Alerts and Ending Alert Fatigue

An SLO-based alert measures how fast the error budget is spent (burn rate) over a long and a short window together: the long window stays quiet on short spikes, the short one closes the alert soon after the outage. For Bookstore's checkout we turn the Workbook's 14.4/6/1 thresholds into Prometheus rules, test them with promtool, measure when they fire and stop in a live outage, and compare them with what Sloth generates.
Version note: The examples in this post were run with .NET 10, OpenTelemetry .NET 1.21, Prometheus 3.16.0 (including promtool) and Sloth 0.16.0.
Guess First
The SLO for the checkout of Bookstore, the online bookstore used as the shared example across this site's series, is 99.5 percent. After three trouble-free days, every checkout request fails for five minutes. In which minute does the Workbook's "burn rate 14.4 over a 1-hour window" alert fire: immediately, in the first minute, in the fifth? If the error rate were 10 percent instead of 100, how many minutes later would the same alert fire? And how long does the alert take to go quiet once the outage is over? We measured the answers in promtool unit tests and in a live outage.
Symptoms, Not Causes
Classic alerts look at causes: "CPU above 80 percent", "disk 90 percent full", "thread pool queue above 100". Each of these can be the cause of a problem, but they can fire without users being affected, and none of them may fire when users are affected. In the second post of the series the API's CPU did not change at all while the payment provider was failing; 5 percent of checkouts still failed. A symptom-based alert looks directly at what users go through: is the SLI getting worse?
The second distinction is who the alert goes to. A page, the alert that wakes the on-call person by phone even at night, is only for situations that need action now. A ticket, a work item looked at during working hours, is for problems that can wait. Every page is time taken from someone's sleep or focus; an alert has to earn being a page.
The "Alerting on SLOs" chapter of the SRE Workbook judges an alerting strategy by four measures. Precision: how many of the alerts that fired were really significant events (events that eat a large part of the budget). Recall: how many significant events produced an alert. Detection time: how long after the problem started the alert came. Reset time: how long after the problem ended the alert went quiet. A single threshold cannot do well on all four at once; the approach this post is about uses two windows together for that.
Burn Rate
Burn rate is how fast the error budget is spent: the observed error rate divided by the error rate the SLO allows. For checkout the allowed rate is 0.5 percent. With an error rate of 0.5 percent the burn rate is 1: the budget runs out in exactly 30 days. At 5 percent the burn rate is 10: the budget runs out in 3 days. At 100 percent the burn rate is 200: the 30-day budget runs out in 3.6 hours.
This definition ties the alert threshold to the budget. "We spent 2 percent of the 30-day budget in 1 hour" means a burn rate over the 1-hour window of 30 days × 24 hours × 0.02 = 14.4. The table the Workbook recommends is built on this logic; these are the values we checked against the primary source:
| Severity | Long window | Short window | Burn rate | Budget spent | Error rate for checkout |
|---|---|---|---|---|---|
| Page | 1 hour | 5 minutes | 14.4 | 2 percent | 7.2 percent |
| Page | 6 hours | 30 minutes | 6 | 5 percent | 3 percent |
| Ticket | 3 days | 6 hours | 1 | 10 percent | 0.5 percent |
The long window gives precision: a short spike is not enough to spend 2 percent of the budget over a 1-hour window, so the alert does not fire. The short window shortens the reset time: the moment the problem ends, the 5-minute window starts to clear, and the alert goes quiet while the 1-hour window is still high. The Workbook suggests a short window of 1/12 of the long one. The two page rows catch different speeds: the 1-hour row catches outages that burn fast, the 6-hour row slower but longer ones. The ticket row says "at this pace the budget runs out by the end of the month".
Turning Burn Rate into Prometheus Rules
We wrote the error rate of each window into a recording rule; the alerts compare these series. The rules are in deploy/prometheus/rules/slo-alerts.yaml (the same pattern for 5m, 30m, 1h, 6h and 3d; two of them here):
# Multiwindow, multi-burn-rate alerts for the checkout availability SLO (99.5 %, error budget 0.005).
# Burn rate = error ratio / 0.005. Thresholds from the SRE Workbook, "Alerting on SLOs":
#   page:   1h window and 5m window above 14.4  (2 % of a 30-day budget in one hour)
#   page:   6h window and 30m window above 6    (5 % of the budget in six hours)
#   ticket: 3d window and 6h window above 1     (10 % of the budget in three days)
# The short window (1/12 of the long one) makes the alert stop soon after the problem is gone.
groups:
  - name: bookstore-slo-burn
    rules:
      - record: slo:checkout_availability:error_ratio_rate5m
        expr: |
          1 - sum(rate(http_server_request_duration_seconds_count{job="bookstore-api", http_route="/api/orders/", http_request_method="POST", http_response_status_code=~"[23].."}[5m]))
            / sum(rate(http_server_request_duration_seconds_count{job="bookstore-api", http_route="/api/orders/", http_request_method="POST", http_response_status_code=~"[235]..|429"}[5m]))
      - record: slo:checkout_availability:error_ratio_rate1h
        expr: |
          1 - sum(rate(http_server_request_duration_seconds_count{job="bookstore-api", http_route="/api/orders/", http_request_method="POST", http_response_status_code=~"[23].."}[1h]))
            / sum(rate(http_server_request_duration_seconds_count{job="bookstore-api", http_route="/api/orders/", http_request_method="POST", http_response_status_code=~"[235]..|429"}[1h]))

      - alert: CheckoutErrorBudgetBurn
        expr: |
          slo:checkout_availability:error_ratio_rate1h > (14.4 * 0.005)
          and
          slo:checkout_availability:error_ratio_rate5m > (14.4 * 0.005)
        labels:
          severity: page
          long_window: 1h
        annotations:
          summary: "Checkout is burning its 30-day error budget 14.4 times too fast (1h and 5m windows)"
      - alert: CheckoutErrorBudgetBurn
        expr: |
          slo:checkout_availability:error_ratio_rate6h > (6 * 0.005)
          and
          slo:checkout_availability:error_ratio_rate30m > (6 * 0.005)
        labels:
          severity: page
          long_window: 6h
        annotations:
          summary: "Checkout is burning its 30-day error budget 6 times too fast (6h and 30m windows)"
      - alert: CheckoutErrorBudgetBurn
        expr: |
          slo:checkout_availability:error_ratio_rate3d > (1 * 0.005)
          and
          slo:checkout_availability:error_ratio_rate6h > (1 * 0.005)
        labels:
          severity: ticket
          long_window: 3d
        annotations:
          summary: "Checkout will use up its 30-day error budget at this pace (3d and 6h windows)"
The three alerts share a name and differ in the long_window label. That way Alertmanager groups them as one alert, while the label tells which row fired. We did not use for: the short window is already a kind of waiting period; adding for on top lengthens the detection time and breaks the Workbook's calculations. Setting up Prometheus, loading rule files and connecting Alertmanager are the topic of the Observability series' alerting post; this post only covers how an SLO turns into an alert.
Testing the Alerts with promtool
You do not have to wait for an outage in production to see that an alert works. promtool test rules evaluates the rules minute by minute over given time series and checks which alerts should be firing at given moments. The series notation is short: 0+600x4320 is a counter starting at 0 that grows by 600 at each of 4,320 steps. In our first test file the scenarios started with two quiet hours, and the test failed like this:
promtool test rules slo-alerts.test.yaml
Processing test file: slo-alerts.test.yaml
  FAILED:
    alertname: CheckoutErrorBudgetBurn, time: 2h40m,
        exp:[],
        got:[
            0:
              Labels:{alertname="CheckoutErrorBudgetBurn", long_window="3d", severity="ticket"}
              Annotations:{summary="Checkout will use up its 30-day error budget at this pace (3d and 6h windows)"}
            ]
...
    alertname: CheckoutErrorBudgetBurn, time: 1h15m,
        exp:[],
        got:[
            0:
              Labels:{alertname="CheckoutErrorBudgetBurn", long_window="3d", severity="ticket"}
              Annotations:{summary="Checkout will use up its 30-day error budget at this pace (3d and 6h windows)"},
            1:
              Labels:{alertname="CheckoutErrorBudgetBurn", long_window="6h", severity="page"}
              Annotations:{summary="Checkout is burning its 30-day error budget 6 times too fast (6h and 30m windows)"}
            ]
This failure teaches something: the 3-day and 6-hour windows held only two hours of data. Prometheus computes rate with whatever data the window has, so in a freshly started service the "3-day" error rate is really the error rate of the last two hours. That is why the ticket and the 6-hour page fired far too early. The same happens in production for a newly deployed service whose metrics start from zero. We fixed the tests so that three quiet days come before every scenario:
# Unit tests for the burn-rate alerts: promtool test rules deploy/prometheus/tests/slo-alerts.test.yaml
# Checkout traffic is 600 requests a minute in every test; only the share of 502 answers changes.
# Every scenario starts after three quiet days, so the long windows (6h, 3d) are full as in production.
rule_files:
  - ../rules/slo-alerts.yaml

evaluation_interval: 1m

tests:
  # ... (the 10 % error and the three-day ticket scenarios)

  # Five minutes in which every checkout fails, after three days without errors: burn rate 200, a page after about 4.3 minutes,
  # and quiet again a few minutes after it ends.
  - interval: 1m
    input_series:
      - series: 'http_server_request_duration_seconds_count{job="bookstore-api", http_route="/api/orders/", http_request_method="POST", http_response_status_code="201"}'
        values: '0+600x4320 2592000+0x5 2592000+600x30'
      - series: 'http_server_request_duration_seconds_count{job="bookstore-api", http_route="/api/orders/", http_request_method="POST", http_response_status_code="502"}'
        values: '0+0x4320 600+600x4 3000+0x30'
    alert_rule_test:
      - eval_time: 72h4m
        alertname: CheckoutErrorBudgetBurn
        exp_alerts: []
      - eval_time: 72h5m
        alertname: CheckoutErrorBudgetBurn
        exp_alerts:
          - exp_labels:
              severity: page
              long_window: 1h
            exp_annotations:
              summary: "Checkout is burning its 30-day error budget 14.4 times too fast (1h and 5m windows)"
      - eval_time: 72h15m
        alertname: CheckoutErrorBudgetBurn
        exp_alerts: []
promtool test rules deploy/prometheus/tests/slo-alerts.test.yaml
Processing test file: slo-alerts.test.yaml
SUCCESSThe answers to Guess First are in these tests. 100 percent errors means a burn rate of 200 for a 0.5 percent budget; reaching 7.2 percent over the 1-hour window takes 60 × 0.072 = 4.3 minutes. The test confirms it: no alert at minute 4, an alert at minute 5. With a 10 percent error rate (burn rate 20) the same alert would, by the calculation, only fire at minute 43; the first scenario checks that it is quiet at minute 40 and firing at minute 45. Once the outage is over, the alert goes quiet when the 5-minute window clears; the 1-hour window still shows 8.3 percent at that point.
A Live Outage
The tests confirm the logic; we also wanted to see how the same rules behave with real traffic. We started Prometheus with an empty database, the traffic tool sent four journeys a second from 20:42:20, and 20 minutes later we set the fake payment provider to reject 30 percent of charges for 10 minutes. A 30 percent error rate means a burn rate of 60 for a 0.5 percent budget:
curl -X PUT http://localhost:5090/admin/faults -H "content-type: application/json" -d '{"failRatio":0.3}'
{"failRatio":0.3,"slowRatio":0.002,"slowDelayMs":1500}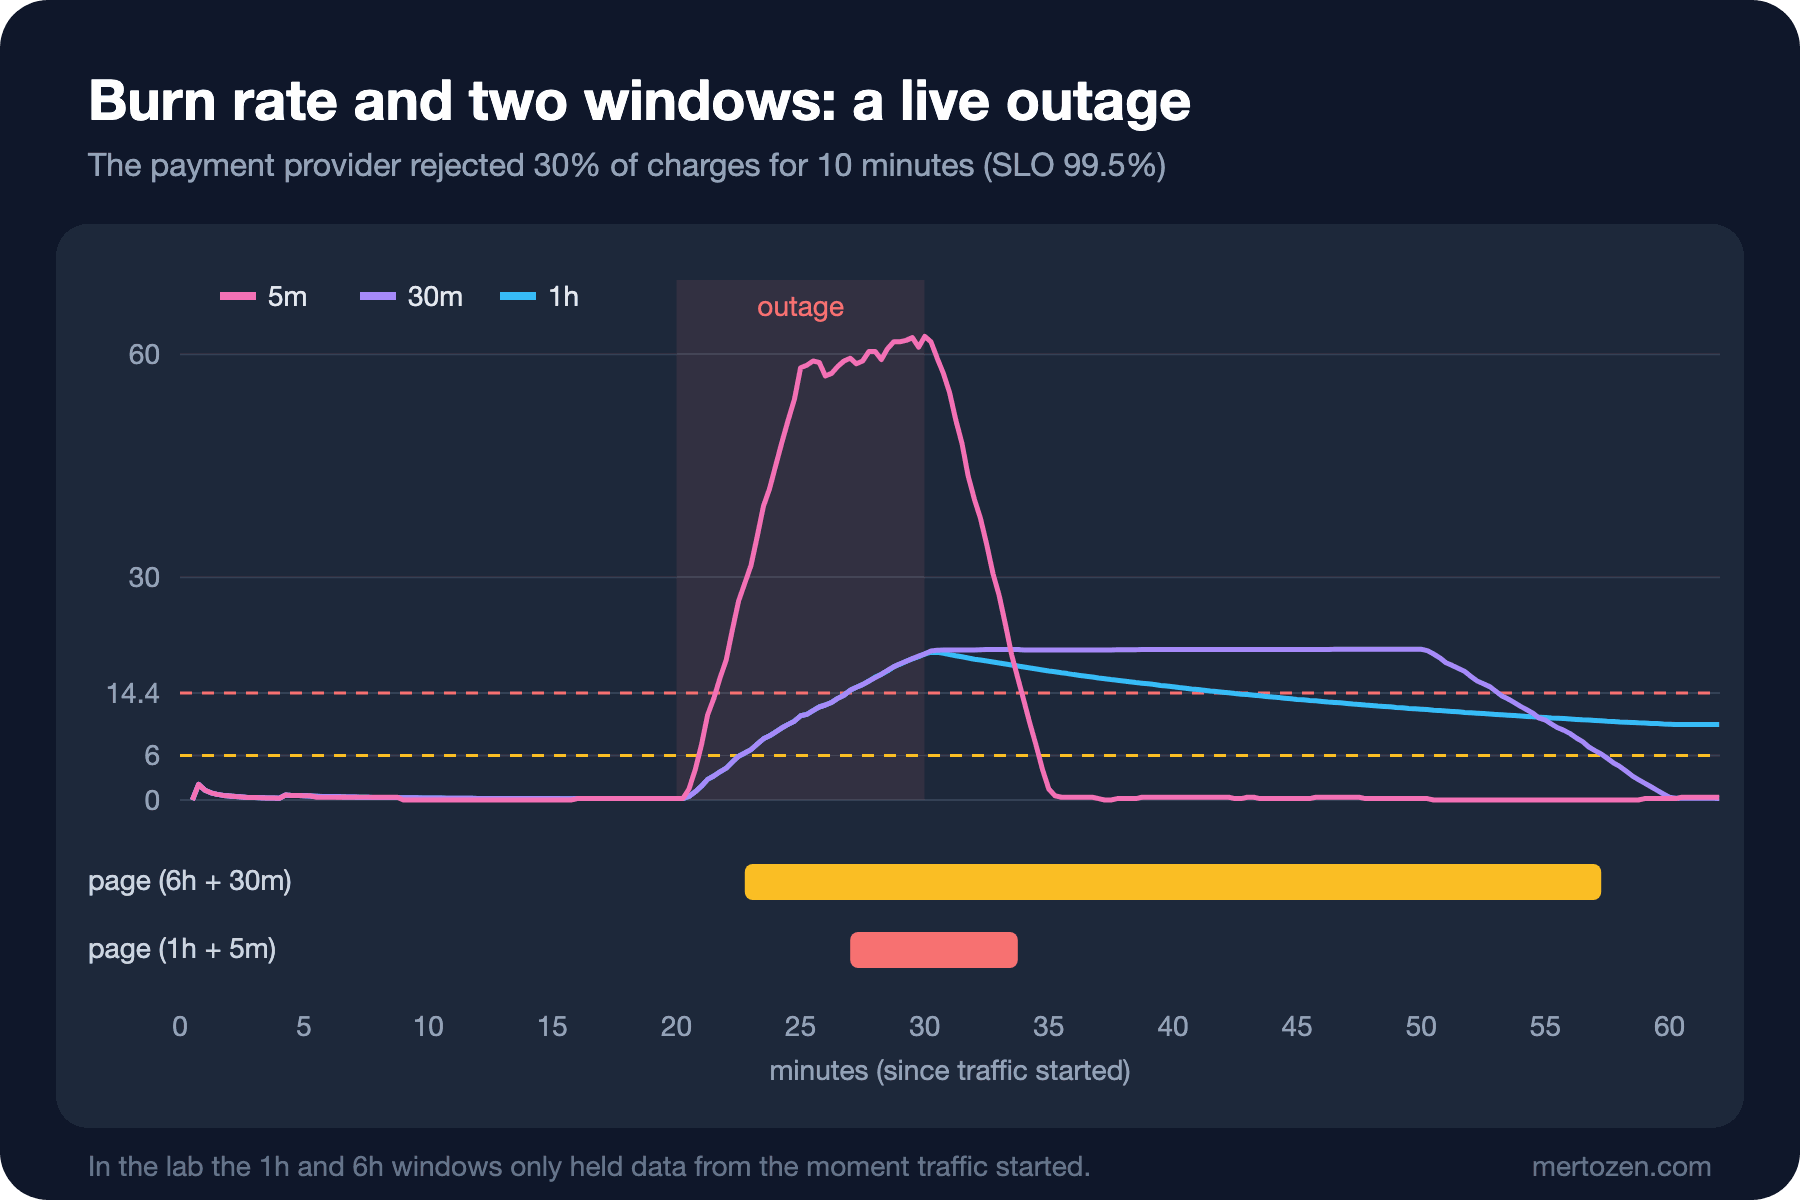
The times read from the ALERTS series (UTC):
- 20:43:05: the ticket fired for 15 seconds. A single 502 in the first minute of traffic exceeded 0.5 percent, because the "3-day" window held only one minute of data.
- 21:02:20: the outage started. At 21:03:05 the ticket fired again and stayed on until the end of the run.
- 21:05:05: the 6-hour page fired, 2 minutes 45 seconds into the outage.
- 21:09:20: the 1-hour page fired, 7 minutes into the outage.
- 21:12:20: the outage ended. At 21:16:05 the 1-hour page went quiet (3 minutes 45 seconds later); the 6-hour page kept firing until 21:39:35, 27 minutes longer.
The difference in reset time is plain in the figure: the short window of the 1-hour page is 5 minutes, that of the 6-hour page 30 minutes. When the outage ended the 1-hour window still showed a 9.8 percent error rate; without the short window the page would have kept firing for the rest of the hour.
But the real lesson of this lab is that the two pages that fired here would not fire in production. Prometheus had been running for only an hour in this run: the "1-hour" and "6-hour" windows actually saw the 20–30 minutes since traffic started, which is why the 30m and 1h lines in the figure lie on top of each other until the outage ends. In a full 1-hour window, a 30 percent error rate would take 60 × 0.072 / 0.3 = 14.4 minutes to reach 7.2 percent; the outage ended after 10 minutes and the window would have peaked at 5 percent. Reaching 3 percent in the 6-hour window would have taken 36 minutes. This outage spent about 1.4 percent of the 30-day budget (the equivalent of a 3-minute full outage, with a budget of 216 minutes); the Workbook's thresholds deliberately treat that as an event that is not worth a page. In a freshly started Prometheus, in a newly deployed service whose metrics start from zero, or after data loss, the long windows behave like short ones in the same way; judge the pages of such a period with that in mind.
Sloth and Pyrra
Writing these rules by hand is instructive, but copying five recording rules and three alerts for every SLO is error-prone. Sloth generates all the rules from an SLO definition. The same availability SLO in Sloth's format:
# The same availability SLO as a Sloth spec. Sloth generates the recording rules and burn-rate alerts:
#   sloth generate -i deploy/slo/checkout.sloth.yaml -o checkout.sloth.rules.yaml
# We keep our hand-written rules (deploy/prometheus/rules/slo-alerts.yaml); this file is for comparison.
version: "prometheus/v1"
service: "bookstore-api"
labels:
  owner: "bookstore-team"
slos:
  - name: "checkout-availability"
    objective: 99.5
    description: "Checkout requests that did not fail on our side."
    sli:
      events:
        error_query: sum(rate(http_server_request_duration_seconds_count{job="bookstore-api",http_route="/api/orders/",http_request_method="POST",http_response_status_code=~"5..|429"}[{{.window}}]))
        total_query: sum(rate(http_server_request_duration_seconds_count{job="bookstore-api",http_route="/api/orders/",http_request_method="POST",http_response_status_code=~"[235]..|429"}[{{.window}}]))
    alerting:
      name: CheckoutAvailabilityBudgetBurn
      page_alert:
        labels:
          severity: page
      ticket_alert:
        labels:
          severity: ticket
sloth generate -i deploy/slo/checkout.sloth.yaml -o checkout.sloth.rules.yaml
# checkout.sloth.rules.yaml: 15 recording rules, 2 alerts; the page alert:
- alert: CheckoutAvailabilityBudgetBurn
expr: |
(
max(slo:sli_error:ratio_rate5m{sloth_id="bookstore-api-checkout-availability", sloth_service="bookstore-api", sloth_slo="checkout-availability"} > (14.4 * 0.005)) without (sloth_window)
and
max(slo:sli_error:ratio_rate1h{sloth_id="bookstore-api-checkout-availability", sloth_service="bookstore-api", sloth_slo="checkout-availability"} > (14.4 * 0.005)) without (sloth_window)
)
or
(
max(slo:sli_error:ratio_rate30m{sloth_id="bookstore-api-checkout-availability", sloth_service="bookstore-api", sloth_slo="checkout-availability"} > (6 * 0.005)) without (sloth_window)
and
max(slo:sli_error:ratio_rate6h{sloth_id="bookstore-api-checkout-availability", sloth_service="bookstore-api", sloth_slo="checkout-availability"} > (6 * 0.005)) without (sloth_window)
)
labels:
severity: page
sloth_severity: page
annotations:
summary: '{{$labels.sloth_service}} {{$labels.sloth_slo}} SLO error budget burn
...Sloth also adds extra series for budget tracking to the rules it generates (such as slo:period_error_budget_remaining:ratio). The page alert it generates is the same as our two page rows, but the ticket side differs: burn rate 3 over 2-hour/1-day windows and burn rate 1 over 6-hour/3-day windows. What matters is not which one is right but which one the team chose; that is what writing the table into the document is for. Pyrra (another SLO tool under the Prometheus community, currently at version 0.10.2) generates similar rules and adds a web UI that shows the SLOs and the remaining budget; it runs as a CRD on Kubernetes and from files outside it. We did not run Pyrra in this post; it is described from its documentation.
In Production
Low traffic. As we saw in the previous post, on the institutional portal with 40 orders a day a single error means a 100 percent error rate over a 5-minute window. The short window crosses the threshold with one request, the long window with a few errors. The options: synthetic traffic, a minimum request count condition (such as and sum(rate(…[1h])) > 0.1), or only a ticket instead of a page for that service.
Spikes during a deploy. During a rolling deploy, a few half-finished requests on instances shutting down can produce a visible error rate over a 5-minute window, but not 7.2 percent over the 1-hour window. That is the biggest benefit of the multiwindow approach: it stays quiet on short spikes. Still, a service that deploys often needs proper graceful shutdown (the zero-downtime prerequisites post of the Deployment Strategies series).
A separate page per service. A separate burn rate alert for each of ten microservices means ten separate phone calls during one database outage. Tie pages to user journeys (checkout, search), not to services. Grouping and inhibition in Alertmanager reduce this load; we look at them in the next post.
The same pattern for the latency SLO. For latency the error rate is "the share of valid requests above 800 ms" and the allowed rate is 1 percent; the thresholds become 14.4 × 0.01 and 6 × 0.01.
Common Pitfalls
A single window. An alert looking only at a 5-minute window fires on every short spike; one looking only at a 1-hour window keeps firing for an hour after the outage is over. Both together.
Testing a long window with short data. Like the first test file above; calling an alert correct without a scenario in which the long window is full is misleading.
Choosing the threshold independently of the SLO. A threshold like "page if the error rate goes above 5 percent" fires far too late for a 99.9 percent SLO and far too early for a 95 percent one. The threshold is always burn rate × allowed error rate.
Lengthening the wait with for. "Too many false alarms, let's add for: 15m" adds 15 minutes to the detection time and quietly spends part of the budget during the very outage. If there are many false alarms, the cause is usually the window or the SLI definition.
A Small Experiment
★☆☆ Add a scenario with a 50 percent error rate to slo-alerts.test.yaml. First compute the minute the 1-hour page should fire (60 × 0.072 / 0.5), then write the test for the minute before and the minute after.
★★☆ Write the same three alerts for the checkout latency SLO (99 percent under 800 ms). The error rate is the share of valid requests outside the le="0.8" bucket. Set the fake provider's slowRatio to 0.2 and see which alert fires.
★★★ Write a test that shows what the short window does: 10 minutes of 50 percent errors followed by a quiet hour. Remove the short window (only the 1-hour condition) and measure with promtool how much longer the alert keeps firing after the outage ends.
The alert now fires at the right time. But the person whose phone rings at two in the morning has to know what to do. In the next post we set up the on-call rotation (rotation, escalation, handoff), separate pages from tickets in Alertmanager, and write a runbook for this alert whose first five minutes were tried on a real outage.