

Choosing SLIs: From User Journeys to Measurable Signals
A good SLI comes from the user's journey and is the ratio of good events to valid events; 4xx answers and health checks stay out of the denominator. For Bookstore's checkout we write availability and latency SLIs from ASP.NET Core's http.server.request.duration histogram and measure how mixing all endpoints and averaging hide errors, and why the application metric sees nothing while the API is down.
Version note: The examples in this post were run with .NET 10, OpenTelemetry .NET 1.21 and Prometheus 3.16.0 (the official prom/prometheus image, with the OTLP receiver enabled).
Guess First
While a traffic tool was sending four user journeys a second to Bookstore, the online bookstore used as the shared example across this site's series, we stopped the API process for exactly 60 seconds. In that minute the traffic tool got no answer at all to 491 requests, and not a single order could be placed. In the same minutes, what did the checkout availability SLI computed from the application's own metric show: 70 percent, 90 percent, or something else? Second question: when the payment provider rejected 5 percent of requests for four minutes, the success rate across all of the API's endpoints came out at 98.96 percent. What was the real rate for a customer trying to check out? The answers are halfway down.
Start with Critical User Journeys
Choosing an SLI starts with the user, not with the list of metrics. The "Implementing SLOs" chapter of the SRE Workbook uses the idea of a CUJ, a critical user journey: the sequence of steps a user follows through the product and cannot do without. The examples it gives for an online shop fit Bookstore exactly. We picked three CUJs for Bookstore: searching for a book, adding it to the cart and paying. Each journey maps to one or more endpoints of the API:
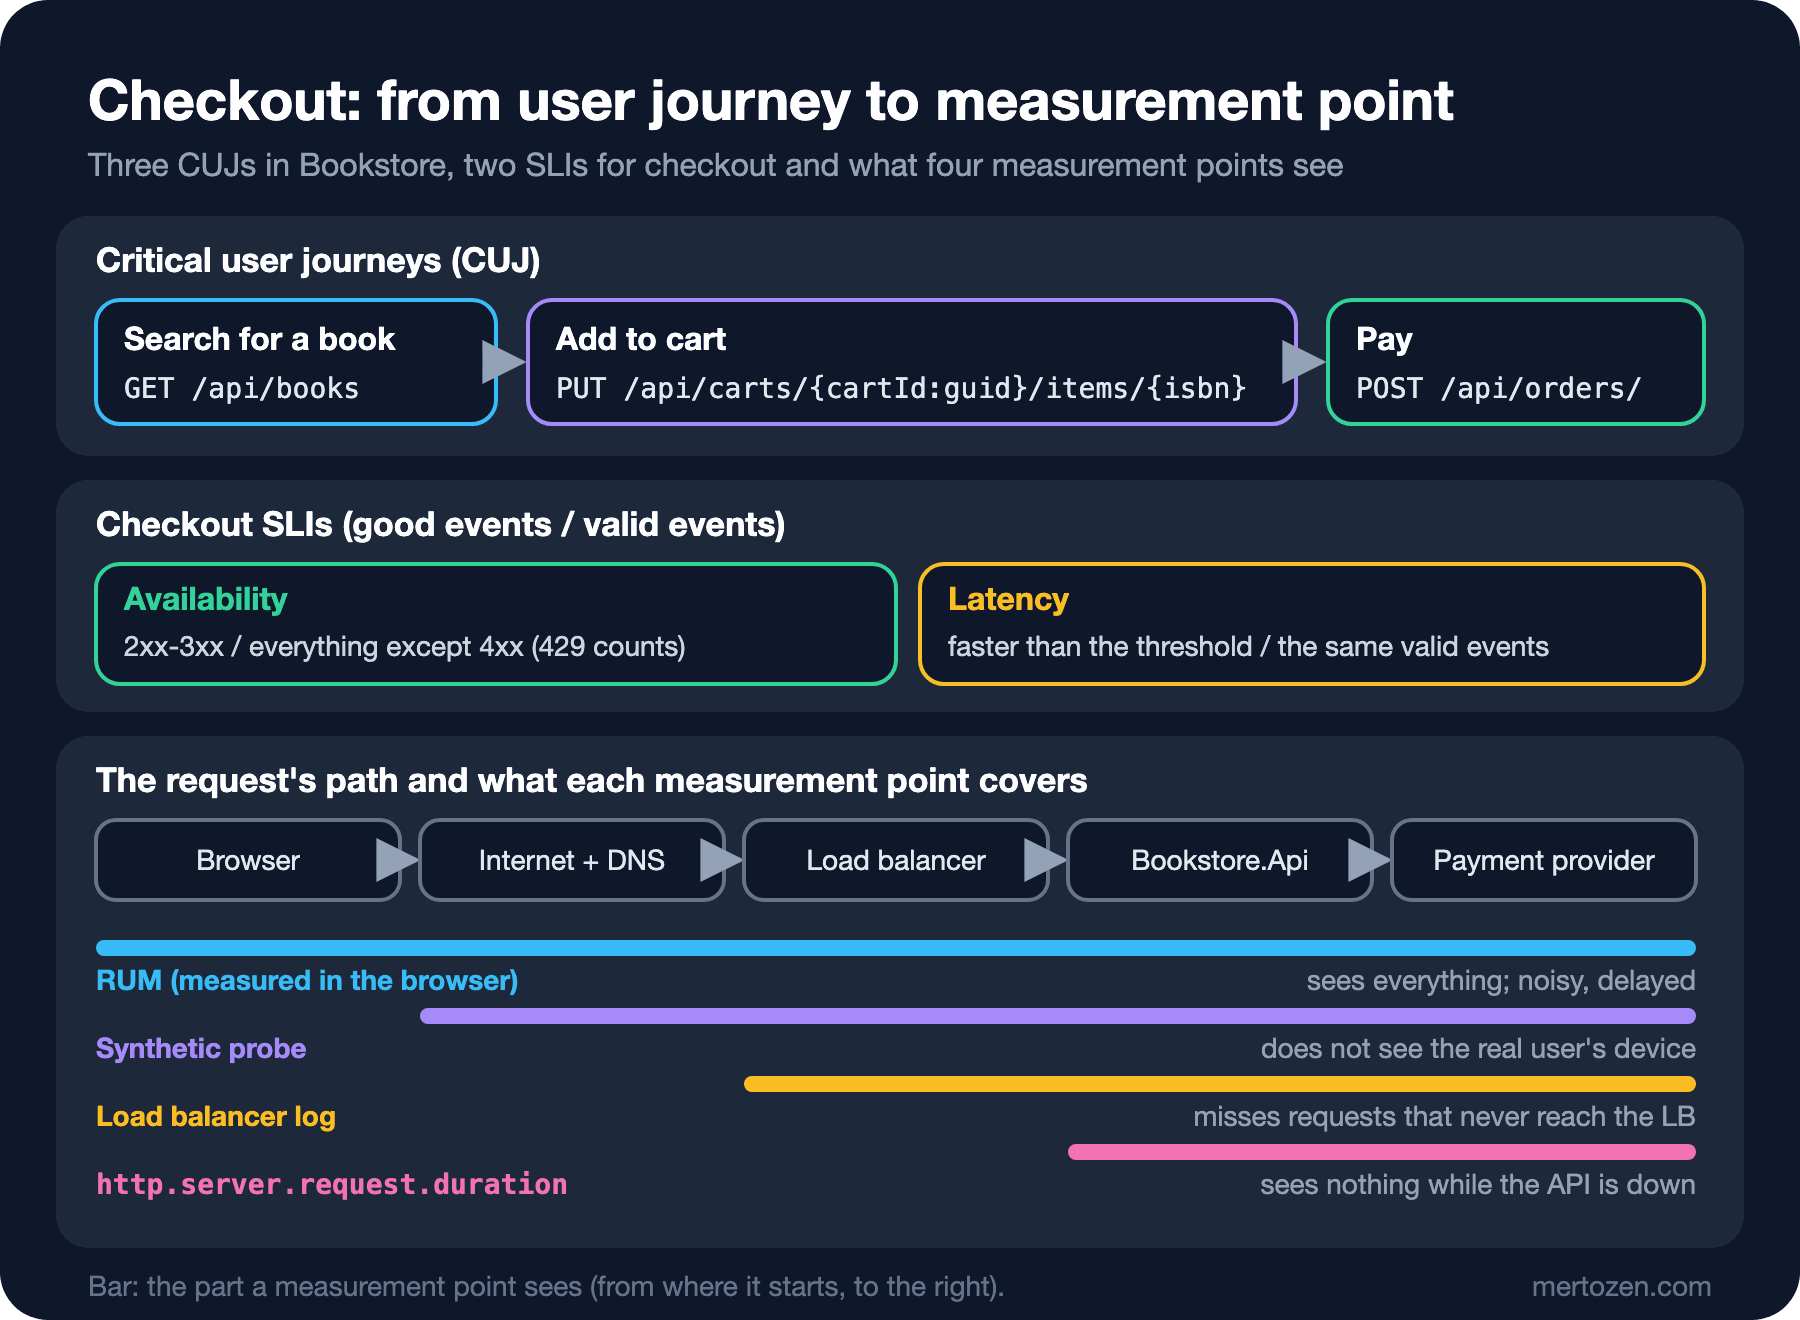
A journey can consist of several calls; "search for a book" includes the search list and the book detail. Rather than defining an SLI per endpoint, it makes more sense to tie it to the step of the journey that matters most. In this post we focus on checkout, the POST /api/orders call: that is where Bookstore makes money, and it goes out to an external dependency, the payment provider.
Kinds of SLI
Once the journey is clear, the question "what does the user count as a bad experience on this journey" picks the kind of SLI:
- Availability: was the request answered successfully? The main SLI for checkout.
- Latency: did the answer come fast enough? A customer who waits 5 seconds on the payment page reloads it or gives up.
- Freshness: how current is the data shown? How many minutes the stock shown in the catalog lags behind warehouse receipts.
- Correctness: is the answer right? The cart total matching the sum of its lines; a wrong total returned with HTTP 200 does not hurt availability but loses the customer.
- Throughput: how much work got done in a given time? Lines processed per hour in the bulk import of institutional orders.
For a request/response API, availability and latency are almost always a good enough start. Freshness and correctness usually need a separate measurement (the last successful run time of a job, verification by sampling) and are a later step.
SLI = Good Events / Valid Events
Defining an SLI as a ratio makes the job much easier: the number of good events divided by the number of valid events. The result is a number between 0 and 1; 100 percent means all is well, 0 percent means nothing works. Because every SLI is on the same scale, setting targets and computing the error budget work with the same formula too.
A request-based SLI counts each request as an event: "what share of valid checkout requests in the last 30 days succeeded?" A window-based SLI splits time into slices and counts each slice as good or bad: "in what share of 5-minute slices was p99 under 800 ms?" The "My orders" target in the last post of the Database Performance and Scaling series was of this second kind. A window-based SLI magnifies a single slow request in quiet hours and shrinks a thousand errors in busy hours down to one bad slice. A request-based SLI, which counts what users went through, is more honest for most APIs; this series uses it.
The hard part of the formula is the denominator: which request is "valid"? Requests that are the user's mistake do not measure your service's reliability. A 404 for an ISBN that does not exist, a 400 for a validation error, a 401 for an unauthorized request are correct answers. Counting them as "bad" ties the SLI to user behaviour; counting them as "good" pads the denominator. The cleanest way is to leave 4xx out of the valid events. There is one exception: 429 Too Many Requests. If you are slowing the customer down, that is your capacity problem; 429 is a valid and bad event. Health check requests are not valid events either: the load balancer calls them, not a user, and they almost never fail.
From Bookstore.Api to a Metric
ASP.NET Core writes the duration of every request into the http.server.request.duration histogram, labelled with the route template, the HTTP method and the status code. The metrics side of OpenTelemetry is enough to export it. The details of the setup are in the Observability series; here is only what the SLI needs:
builder.Services.AddOpenTelemetry()
    .ConfigureResource(resource => resource
        .AddService(serviceName: "bookstore-api", serviceVersion: version)
        .AddAttributes([new("deployment.environment.name", builder.Environment.EnvironmentName.ToLowerInvariant())])
        .AddEnvironmentVariableDetector())
    .WithMetrics(metrics => metrics
        .AddAspNetCoreInstrumentation()
        .AddHttpClientInstrumentation())
    // OTEL_EXPORTER_OTLP_ENDPOINT / _PROTOCOL decide where the metrics go (here: Prometheus' OTLP receiver).
    .UseOtlpExporter();
// For the load balancer and Kubernetes probes; not a user journey, so it is left out of the SLIs.
app.MapHealthChecks("/health");We started Prometheus with its OTLP receiver enabled and told the API to push its metrics there. The default export interval is 60 seconds; in the lab we lowered it to 15:
docker run -d --name bookstore-prometheus -p 9090:9090 -v ${PWD}/deploy/prometheus:/etc/prometheus/bookstore:ro prom/prometheus:v3.16.0 --config.file=/etc/prometheus/bookstore/prometheus.yaml --web.enable-otlp-receiver --web.enable-lifecycle$env:OTEL_EXPORTER_OTLP_ENDPOINT = "http://localhost:9090/api/v1/otlp"
$env:OTEL_EXPORTER_OTLP_PROTOCOL = "http/protobuf"
$env:OTEL_METRIC_EXPORT_INTERVAL = "15000"
dotnet run --project src/Bookstore.Apitools/Bookstore.FakePaymentProvider, which stands in for the payment provider, rejects one request in a thousand with 503 by default and holds two in a thousand for 1.5 seconds; PUT /admin/faults changes these ratios while it runs. tools/Bookstore.Traffic runs the three CUJs four times a second, asks for a book that does not exist on one journey in 20, and calls /health every five seconds. In Prometheus, a bucket series of a failed checkout request looks like this:
{__name__="http_server_request_duration_seconds_bucket", deployment_environment_name="development", error_type="502", http_request_method="POST", http_response_status_code="502", http_route="/api/orders/", instance="8c0301ff-95fe-4d8f-accd-f6e63843bd9e", job="bookstore-api", le="1", network_protocol_version="1.1", service_version="1.0.0", url_scheme="http"} 1job comes from service.name in the resource, instance from the service.instance.id the SDK generates for each process. http_route is the route template, not the raw URL; because of MapPost("/") under MapGroup("/api/orders") it ends in a slash. Queries have to spell the value exactly like that.
We wrote the SLIs as recording rules. Each rule produces a ratio that the next post compares with a target:
# SLIs of Bookstore's checkout journey (POST /api/orders), from ASP.NET Core's http.server.request.duration.
# SLI = good events / valid events. 4xx answers are the client's mistake and are not valid events,
# except 429: when we throttle a customer, that is our failure.
groups:
  - name: bookstore-sli
    rules:
      - record: sli:checkout_valid:rate5m
        expr: |
          sum(rate(http_server_request_duration_seconds_count{job="bookstore-api", http_route="/api/orders/",
            http_request_method="POST", http_response_status_code=~"[235]..|429"}[5m]))

      # Availability: valid requests that did not fail on our side.
      - record: sli:checkout_available:rate5m
        expr: |
          sum(rate(http_server_request_duration_seconds_count{job="bookstore-api", http_route="/api/orders/",
            http_request_method="POST", http_response_status_code=~"[23].."}[5m]))
      - record: sli:checkout_availability:ratio_rate5m
        expr: sli:checkout_available:rate5m / sli:checkout_valid:rate5m

      # Latency: valid requests that finished within 1 s (le must be one of the histogram's bucket boundaries).
      - record: sli:checkout_fast:rate5m
        expr: |
          sum(rate(http_server_request_duration_seconds_bucket{job="bookstore-api", http_route="/api/orders/",
            http_request_method="POST", http_response_status_code=~"[235]..|429", le="1"}[5m]))
      - record: sli:checkout_latency:ratio_rate5m
        expr: sli:checkout_fast:rate5m / sli:checkout_valid:rate5m
In the latency SLI the threshold has to be a bucket boundary; ASP.NET Core's default boundaries are 14 values between 0.005 and 10 seconds (… 0.5, 0.75, 1, 2.5 …). The histogram answers "how many requests took less than 1 second" exactly; it cannot answer "how many took less than 800 ms". Choosing the threshold is the topic of the next post.
Mixing In 4xx and All Endpoints
We raised the payment provider's error rate to 5 percent for four minutes (at the same time it held 3 percent of requests for 1.5 seconds) and asked the same window two different questions. First, checkout availability:
sum(increase(http_server_request_duration_seconds_count{job="bookstore-api", http_route="/api/orders/", http_request_method="POST", http_response_status_code=~"[23].."}[4m]))
/
sum(increase(http_server_request_duration_seconds_count{job="bookstore-api", http_route="/api/orders/", http_request_method="POST", http_response_status_code=~"[235]..|429"}[4m]))

{} 0.9461988304093567
Then the query most teams write first, the share of non-5xx requests across all endpoints:
sum(increase(http_server_request_duration_seconds_count{job="bookstore-api", http_response_status_code!~"5.."}[4m]))
/
sum(increase(http_server_request_duration_seconds_count{job="bookstore-api"}[4m]))

{} 0.9895715257311266
That answers the second question from Guess First: 5.4 percent of customers trying to pay got an error, but the "API success rate" showed 98.96 percent. The reason is the denominator: in the same four minutes, 961 searches, 960 book detail calls, the cart calls and 48 health checks were counted as well, and all of them succeeded. One journey's errors dissolve among requests that do not belong to it.
We saw the effect of 4xx on the book detail. Five percent of the traffic asks for an ISBN that does not exist. The SLI that counts 404 as bad returned 0.9500756429652042 over a 3-minute window with no fault at all; the SLI that leaves 4xx out of the denominator returned 1. Had we put a 99 percent target on the first SLI, the error budget would run out every day with nothing broken.
Measurement Point: Who Cannot See What?
The same SLI can be measured from different places, and each place has a blind spot. The application metric (our http.server.request.duration) carries the richest labels but only sees requests that reach Kestrel. The load balancer log also sees the moment the application crashes, but not requests that never reach the load balancer (a DNS failure, a wrong certificate). A synthetic probe, an artificial request sent from outside at regular intervals, keeps working while the API is down, but does not carry the real user's device or the variety of real data. RUM, real user monitoring done in the user's browser, sees the most, but it is the noisiest and its data arrives late.
That is why we asked the first question in Guess First. We stopped the API at 20:20:24 and started it again at 20:21:24. The traffic tool's line for that minute:
20:20 UTC book=240 cart=228 checkout=228 health=12 search=240 5xx=0 no-answer=0 404=12 slowest-checkout=1512ms
20:21 UTC book=240 health=12 search=240 5xx=0 no-answer=491 404=0 slowest-checkout=0ms
20:22 UTC book=240 cart=225 checkout=225 health=12 search=240 5xx=0 no-answer=7 404=12 slowest-checkout=1517ms
The recording rule's values in the same minutes (one line per 30 seconds; times in UTC):
20:19:54 0.9538
20:20:24 0.9575
20:20:54 0.9587
20:21:24 0.9602
20:21:54 0.9647
20:22:24 0.9757
In the minute it was down, the SLI did not drop; it rose, because the minutes with payment errors were leaving the 5-minute window. The requests that got no answer never reached the application, so they were neither numerator nor denominator. The only trace is the drop in the rate of valid events: sli:checkout_valid:rate5m went from 3.8 to 2.77 a second. The application metric is a good start for an SLI, but on its own it cannot see "the service is down". To close that gap, either use the load balancer's metric or add a synthetic probe that calls checkout from outside; the upcoming alerting post of the Observability series sets up blackbox probes for this.
In Production
With several instances, sum first, then divide. In the rules, sum(rate(…)) happens before the division; computing each instance's own ratio and averaging them gives an instance with little traffic more weight than it deserves.
A restart changes the series. The instance label above gets a new value every time the process starts; after a deploy the old series stop and new ones begin. rate and sum handle that correctly, but on a dashboard grouped by instance the old series look "stuck" for a while.
Know the export interval. The OTLP exporter's default is 60 seconds. In a 5-minute window that is only five samples; a short outage shows up with up to one sample of delay. If you scrape, the same goes for the scrape interval.
Change the SLI definition together with the code. A refactor that changes the route template (/api/v2/orders instead of /api/orders/) silently drops the SLI to zero traffic. The rule file lives in the repo and should be updated in the same pull request as the API.
Common Pitfalls
Making average latency the SLI. During the fault window the average checkout time was 0.117 seconds, in the window without faults 0.098 seconds: almost no difference. In the same window 98.1 percent of requests were under 1 second (99.84 percent in the window without faults) and p99 went from 0.247 to 1.698 seconds. The average hid the slow 2 percent among the fast 98.
Mistaking CPU for an SLI. With CPU at 90 percent the user may feel nothing; at 10 percent every checkout may fail because of the payment provider. CPU is a cause signal; an SLI should measure the symptom, what the user goes through.
Cardinality explosion. Our bucket series add up to 120: six route templates, a few status codes, 15 buckets. If the label were the raw URL, every cart ID (/api/carts/0193…/items/…) would open a new series, reaching hundreds of thousands within a few hours. Because ASP.NET Core uses the route template this is not a problem by default; apply the same rule when you add labels to your own metrics.
Forgetting the denominator. "3 errors in the last 5 minutes" is not an SLI; 3 errors are nothing at 50 requests a second and a disaster at 5 requests a minute. Always a ratio.
A Small Experiment
★☆☆ Write an availability SLI recording rule for the "search for a book" journey on GET /api/books. While traffic runs, raise the provider's error rate with PUT /admin/faults; why is the search SLI not affected at all?
★★☆ Write a second latency SLI for checkout with a 0.5-second threshold. Set the provider's slowRatio to 0.05 and slowDelayMs to 600; explain the difference between the SLIs at the two thresholds.
★★★ Put a synthetic probe in front of the API: a small job that opens a cart and places an order every minute (and writes the success of each attempt to a gauge such as probe_success). Stop the API for 60 seconds again and show that the probe catches that minute while the application metric does not.
We now have two measurable SLIs for checkout. In the next post we give them targets: the difference between SLA, SLO and SLI, the math of nines, adding a bucket to the histogram for an 800 ms threshold, and a policy that says in advance what happens when the error budget runs out.