

The Performance Panel: Live Metrics, Recording Traces, Insights and the Angular Custom Track
The Performance panel splits an interaction into input delay, processing and presentation delay; in zoneless Angular, rendering lands in presentation delay. We measure the INP of typing into a 2000-book list filter at 712 ms on a 20x CPU and fix it with computed signals and @for track; live metrics, the flame chart, long tasks, Insights and the Angular custom track enabled with ng.enableProfiling(), with real trace data.
Version note: The examples in this post were run with Chrome 156 (156.0.8078.80), Angular 22.2 and .NET 10, on a machine with an Apple M5 processor. Traces were recorded with the same Chrome version in headless mode through the Chrome DevTools Protocol (CDP); Insights outputs come from chrome-devtools-mcp 1.12.0, which uses the DevTools trace engine. Panel steps come from the Chrome DevTools and Angular documentation.
Predict First
The Bookstore list has 2000 books, and it narrows as you type in the filter at the top. The first version looks like this:
@Component({
  selector: 'app-book-list-slow',
  imports: [BookCard],
  template: `
    <input class="filter" placeholder="Filter books" [value]="query()" (input)="query.set($any($event.target).value)" />
    <p class="count">{{ visibleBooks().length }} books</p>
    @for (book of visibleBooks(); track $index) {
      <app-book-card [book]="book" (addToCart)="cart.add($event)" />
    }
  `,
})
export class BookListSlow {
  protected readonly cart = inject(CartStore);
  protected readonly query = signal('');
  private readonly books = toSignal(inject(BookService).getBooks(), { initialValue: [] as Book[] });

  protected visibleBooks(): Book[] {
    const q = normalize(this.query());
    return this.books().filter(b => normalize(b.title).includes(q));
  }
}
normalize is expensive on purpose: every call creates a new Intl.Collator and walks the text several times. On a desktop everything feels smooth. So how long does typing "C" into the filter take when the CPU (Central Processing Unit) is slowed down 20 times? And is the time spent in JavaScript or in the DOM (Document Object Model)? Write down a guess, then let's measure.
Live Metrics: Measure Before You Record
When you open the Performance panel, you are greeted not by an empty timeline but by the Live metrics screen. As you interact with the page, LCP (Largest Contentful Paint), CLS (Cumulative Layout Shift) and INP (Interaction to Next Paint) update locally and live. The Interactions list below shows every click and keystroke with its duration, and the Layout shifts list shows the elements that moved. The first answer to "which interaction is slow" is here, without recording a trace at all.
On the same screen, the Field data section can pull the page's real-user data from CrUX (Chrome User Experience Report) and place it next to the local value. That requires allowing the URL (Uniform Resource Locator) to be sent to Google's CrUX API (Application Programming Interface); a local development address has no data. We will cover the lab versus field difference separately in the Lighthouse post.
To bring lab measurements closer to the user's device, you choose CPU and network throttling in Environment settings. Besides fixed slowdown rates, CPU throttling offers low- and mid-tier mobile presets created by calibrating your machine. According to the Chrome 153–154 notes, a calibrated CPU performance tier can be overridden through CDP's Emulation.setCPUPerformanceOverride method, and in Chrome 155–156 the CPU Performance Tier control in the Sensors panel overrides navigator.cpuPerformance; if your app changes behavior based on device power, this is how you test it.
Measuring INP: The Slow List and the Fixed One
On the production build, with the CPU slowed down 4x and 20x, we typed "Comp" into the filter 400 ms apart and collected each interaction's duration with the Event Timing API (PerformanceObserver, type: 'event'). We did the same for the fixed BookList. The real results, from two runs:
/books-slow (CPU 4x): interactions=4 worst=136 ms [input delay 12, processing 0, presentation 124] all=136,56,40,32 | 286 books
/books (CPU 4x): interactions=2 worst=80 ms [input delay 10, processing 0, presentation 70] all=80,24 | 286 books
/books-slow (CPU 20x): interactions=4 worst=712 ms [input delay 37, processing 0, presentation 675] all=712,352,200,200 | 286 books
/books (CPU 20x): interactions=4 worst=440 ms [input delay 43, processing 0, presentation 397] all=440,128,48,48 | 286 books
/books-slow (CPU 20x): interactions=4 worst=672 ms [input delay 35, processing 4, presentation 633] all=672,424,192,184 | 286 books
/books (CPU 20x): interactions=4 worst=400 ms [input delay 42, processing 0, presentation 358] all=400,112,40,40 | 286 books
INP thresholds: up to 200 ms is good, up to 500 ms needs improvement, above that is poor. With a 4x slowdown on the Apple M5 both versions are "good"; at 20x the slow version is in the poor zone at 672–712 ms. The fix brings the first keystroke down to 400–440 ms and the following keystrokes from 200 ms to 40–48 ms. This table says two things. First, most of the cost of the first keystroke exists in both versions: tearing more than 1700 of the 2000 cards out of the DOM. Second, on later keystrokes the DOM change is small; the difference there is entirely our JavaScript.
One more thing stands out: processing is almost zero and all the time is in presentation. In zoneless Angular, the input event handler only sets a signal; the actual render is scheduled for the next frame by Angular's scheduler. Event Timing counts that work as "presentation delay". If you read it as "processing is short, so the code is fast", you will be wrong.
Recording a Trace and the Flame Chart
You start and stop a recording with the Record button in the Performance panel (Ctrl+E, Cmd+E on a Mac); to measure a page load, use Record and reload. Keep the recording small: perform only the interaction you want to inspect, then stop. In a development build, with a 4x slowdown, the trace of the moment we pressed the first key on the slow list gives this picture:
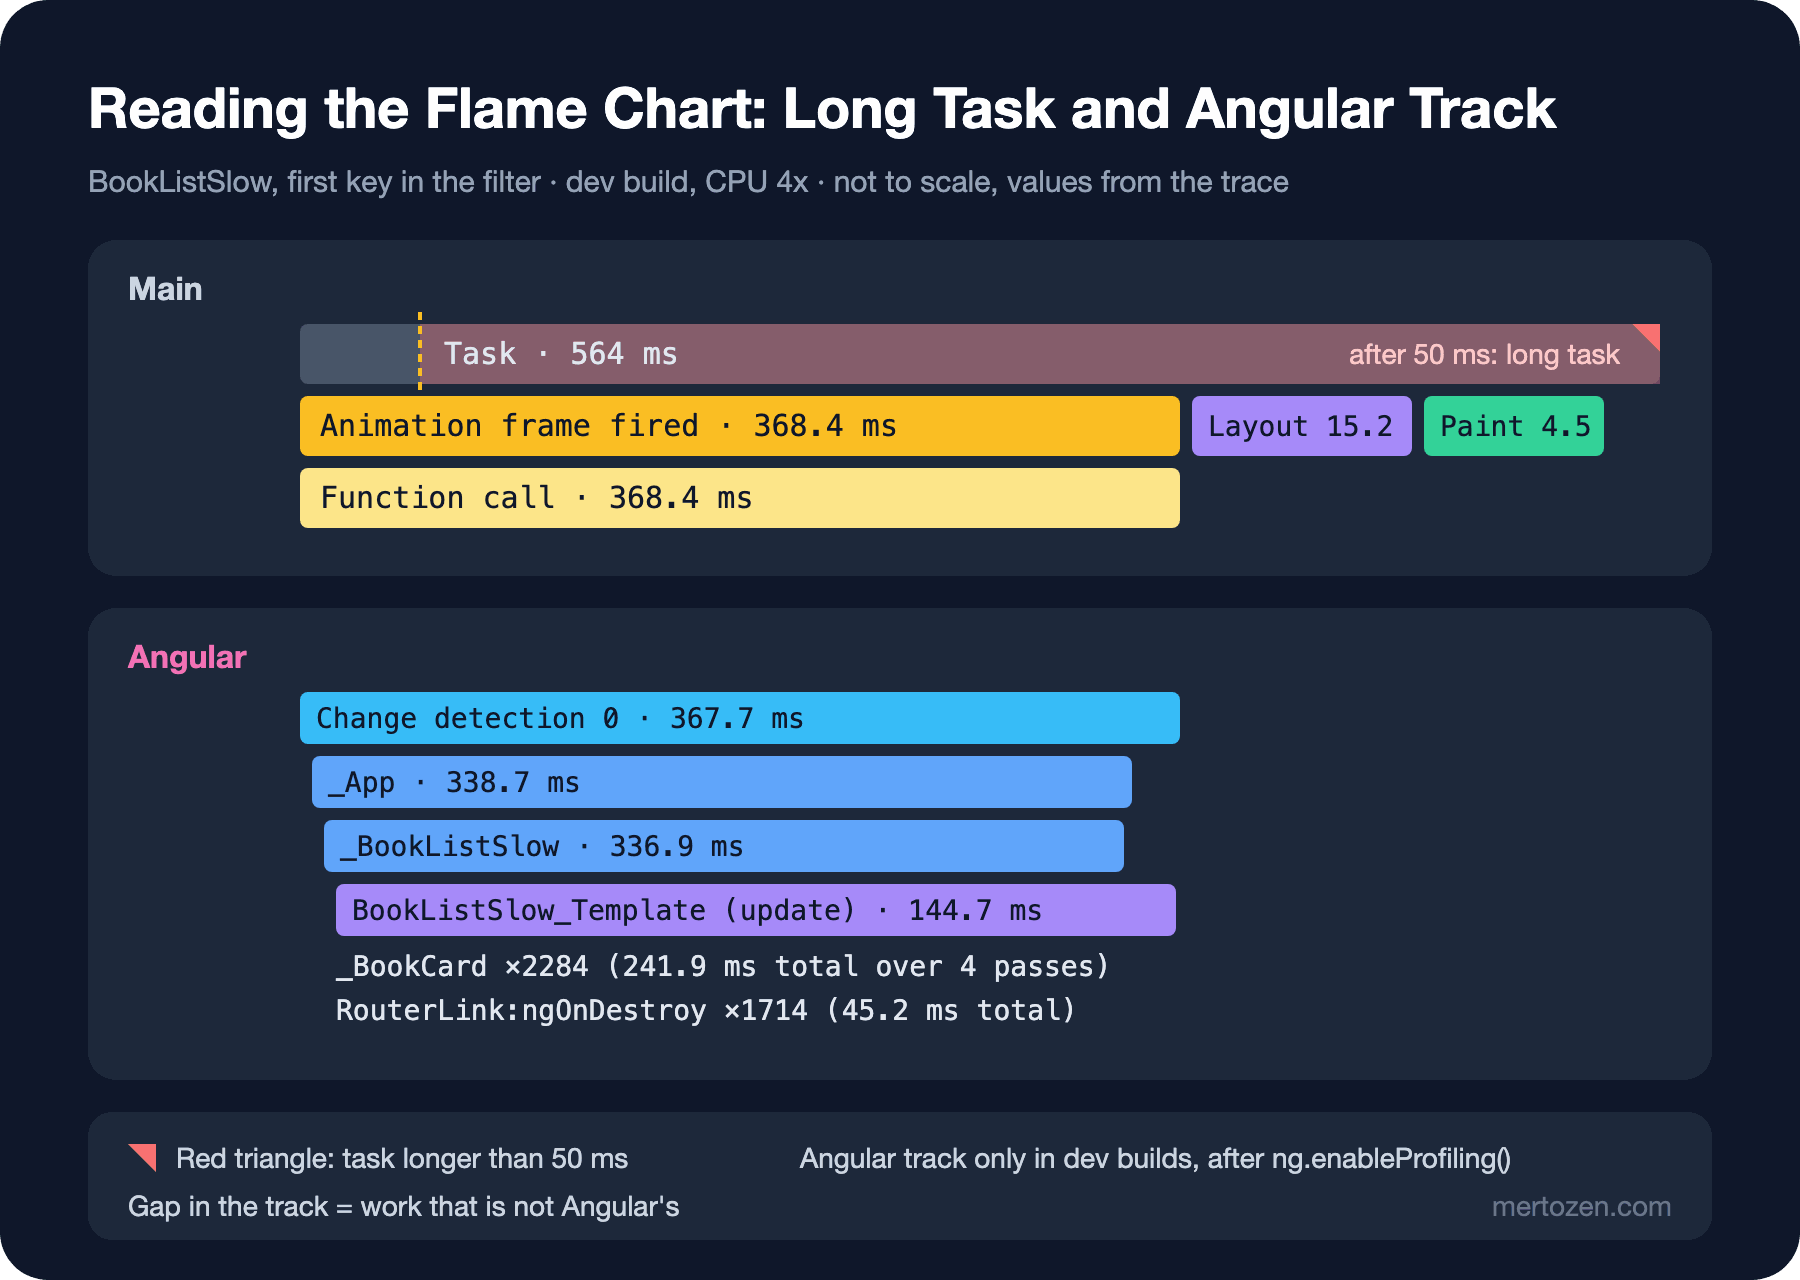
There is a 564 ms task on the Main track; the red triangle in its corner and the red hatching after 50 ms say it is a long task. Inside this task: Animation frame fired 368.4 ms, Layout 15.2 ms, Paint 4.5 ms. In the flame chart, the bar on top is the caller and the ones below are the callees; width is duration. Click a bar to see its duration and source line in the Summary tab, while the Bottom-up tab lists the functions that spent the most self time in that range. You answer "where is it slow" with Bottom-up and "how did we get there" with Call tree. Since Chrome 155–156, expanded nodes and scroll position in Call tree and Bottom-up survive switching to another panel and back.
In a trace of the production build, function names are minified; if the source map is loaded, DevTools translates them back to their original names. But the real detail comes from the Angular track in the next section.
The Angular Custom Track: Seeing Change Detection on the Timeline
In development mode, Angular can add its own track to the Performance panel. There are two ways to turn it on: call ng.enableProfiling() in the console, or turn it on in code before the app starts:
import { enableProfiling } from '@angular/core';
import { bootstrapApplication } from '@angular/platform-browser';
import { appConfig } from './app/app.config';
import { App } from './app/app';

// before bootstrap: record the startup work too
enableProfiling();
bootstrapApplication(App, appConfig)
  .catch((err) => console.error(err));
According to the Angular documentation, this only works in development mode. The track is fed through the DevTools extensibility API with console.timeStamp calls; in the raw trace these entries carry the track name 🅰️ Angular. The recording where we typed "Comp" into the slow list had 8064 Angular entries. The most expensive ones:
     642.0 ms  x4     Synchronization 0
     367.7 ms  x1     Change detection 0
     260.7 ms  x4     BookListSlow_Template (update)
     241.9 ms  x2284  _BookCard
      98.8 ms  x855   BookCard_Template (update)
      46.2 ms  x867   HostBindings
      45.2 ms  x1714  RouterLink:ngOnDestroy
It reads easily: the change detection pass on the first keystroke took 367.7 ms and lines up almost exactly with the 368.4 ms Animation frame fired on the Main track; in other words, all the work in that frame is Angular's. BookListSlow_Template (update) is where the template updates its bindings and calls visibleBooks() twice (for the counter and for @for). The 1714 RouterLink:ngOnDestroy entries are the cleanup of the routerLink directive inside each removed card: every directive you put inside a card component comes back as a multiplier when the list grows. According to the documentation, the colors on the track also mean something: your TypeScript code, compiled template code and entry points into the application are drawn in different colors. If there is work on the Main track in a range where the Angular track is empty, that work is not Angular's: it is layout, paint or a third-party script.
Since Chrome 153–154, Ctrl+F in the flame chart also searches custom tracks added through the extensibility API; type BookCard to highlight all card checks. If Angular DevTools is installed, the link in a component entry's Summary opens it directly in Angular DevTools; this requires a Chrome flag named in the documentation. We cover Angular DevTools in post 09 of this series.
Insights: Letting DevTools Interpret the Trace
The Insights tab on the left of a recording scans the trace for you and lists findings under headings such as LCP breakdown, INP breakdown, layout shift culprits and render-blocking requests. Here is the INP breakdown of a trace we recorded with chrome-devtools-mcp, which uses the same insight engine, on the production build with a 4x slowdown while typing into the slow list:
Metrics (lab / observed):
  - INP: 140 ms, event: (eventKey: s-6213, ts: 769234957450)
  - CLS: 0.00
...
The longest interaction on the page was a `keypress` which had a total duration of `140 ms`. The timings of each of the three subparts were:

1. Input delay: 0.6 ms
2. Processing duration: 29 ms
3. Presentation delay: 110 ms.
Here we typed without pauses between keys, so the number differs from the first measurement; but the picture is the same: the time is in presentation delay. The insight splits it into three subparts and tells you to start with the largest. For the page load, in a trace recorded with Record and reload, LCP was 508 ms: TTFB (Time To First Byte) 7 ms and render delay 501 ms. That picture says the first render of 2000 cards is what the list waits for before it becomes visible. LCPBreakdown, RenderBlocking and DOMSize were at the top of the insight list; the last one points at the 2000-card DOM again.
With Chrome 153–154, Insights also analyzes soft navigations. Changing pages with the router in Angular is not a full page load but a soft navigation; the transition from /books to /cart can now get its own insight set.
The Fix: computed Signals and @for track
The fixed version makes two changes:
@for (book of visible(); track book.id) {
  <app-book-card [book]="book" (addToCart)="cart.add($event)" />
}

private readonly index = computed(() => this.books().map(book => ({ book, key: normalize(book.title) })));
protected readonly visible = computed(() => {
  const q = normalize(this.query());
  return this.index().filter(e => e.key.includes(q)).map(e => e.book);
});
The expensive normalize now runs once per book, when the list arrives, and the result is cached in the index computed. Each keystroke is left with only includes, and because visible is a computed, the calculation runs once even though the template reads it twice. track book.id tells Angular to match rows by identity: when the filter narrows, the DOM and component instances of the remaining cards are reused. Later keystrokes dropping from 200 ms to 40–48 ms in the measurement above is the result. The 400 ms on the first keystroke still comes from the 2000-card DOM; fixing that means rendering less: paging, virtual scrolling or @defer. Those strategies are the subject of the upcoming Web Performance series; debounce and layout thrashing are covered in the Advanced JavaScript series post "JavaScript Performance Tips: Debounce, Throttle and Layout Thrashing".
Production Notes
A lab measurement is a hypothesis. Our 20x results were taken on an Apple M5; the real INP on a user's phone is told by CrUX or your own RUM (Real User Monitoring) data. After you confirm a fix in the lab, do not call it "solved" until you see the field data improve too.
The Angular track and the ng globals only exist in development builds, but a development build is noticeably slower than production: at the same 4x slowdown, the slow list's worst interaction measured 568 ms in the dev build with tracing on and 136 ms in production. Find what is slow in the dev build; measure how slow it is in the production build.
Trace files are large and sensitive: our few-second recording was 45 MB and can contain URLs, script contents and screenshots. Think about what a trace contains before sharing it.
Common Pitfalls
- Measuring on a powerful developer machine without throttling and declaring "INP is fine".
- Clearing the code because processing is short: in zoneless Angular, rendering lands in presentation delay.
- Carrying the absolute durations of a development build over to production.
- Calling methods in the template: they run again on every change detection; use computed for derived values.
- Filtering a list with
track $index: cards are matched by position, not identity. - Recording half a minute and getting lost in it: record only the relevant interaction.
A Small Experiment
★☆☆ Open the Live metrics screen of the Performance panel, set CPU throttling to 4x, and compare the durations in the Interactions list while typing into the filter on /books-slow and /books.
★★☆ In a development build, call ng.enableProfiling() in the console and record a trace while typing a single letter into the slow list. Find the BookListSlow_Template (update) entry on the Angular track, search for RouterLink with Ctrl+F in the flame chart and count how many times it appears.
★★★ Remove the routerLink from BookCard and navigate with a single click handler at the list level instead. Repeat the measurement at 20x, and confirm how much the first keystroke's INP changes and that the RouterLink:ngOnDestroy entries disappear from the Angular track.
The Performance panel measures time; but some problems grow with memory, not time. If you noticed the tab getting slower as you go in and out of the book detail page, the cause is not here. In the next post we compare heap snapshots in the Memory panel and read from the retainer chain why Angular components stay in memory.