

The Network Panel: Waterfall, Timing, Throttling, HAR and Request Overrides

In the Network panel, a request's Timing tab tells you whether slowness is in the network or on the server: for an endpoint that waits 800 ms, 803.1 of 803.9 ms is Waiting (TTFB). The Angular 22 HttpClient preflight, reading a CORS error, filter syntax, throttling, request blocking, Copy as cURL, Edit and resend, mocking with Local Overrides, sanitized HAR and a .NET 10 Server-Sent Events stream, with real outputs from Chrome 156.
Version note: The examples in this post were run with Chrome 156 (156.0.8078.80), Angular 22.2 and .NET 10 (ASP.NET Core 10). Network outputs were captured from the same Chrome version in headless mode through the Chrome DevTools Protocol (CDP), from the events that feed the DevTools Network panel; panel steps come from the Chrome DevTools documentation.
Predict First
Bookstore's Angular app runs at http://localhost:4391 and the API (Application Programming Interface) at http://localhost:5391. When the book list opens, BookService sends a single GET /api/books request, and an interceptor adds an Authorization header to every request:
export const authInterceptor: HttpInterceptorFn = (req, next) => {
  if (!req.url.includes('/api/')) {
    return next(req);
  }
  return next(req.clone({ setHeaders: { Authorization: 'Bearer demo-token-42' } }));
};
How many rows do you see in the Network panel with a /api/books filter? And for an endpoint that waits 800 ms, in which phase of the Timing tab do those 800 ms show up: Stalled, Waiting or Content Download? The answer to the second question is the one line that tells you whether an "the API is slow" complaint comes from the network or the server.
Columns and Filters: Finding the Right Row
We opened the Network panel and reloaded the page. The types of the 31 requests the page made:
page requests total: 31 | types: {"Document":1,"Script":24,"Stylesheet":1,"Manifest":1,"Preflight":1,"Fetch":1,"Other":2}The 24 scripts are the framework and application files that the dev server serves piece by piece. The two rows doing the real work are a Preflight and a Fetch. In Angular 22, HttpClient uses the Fetch API by default, and going back to XHR (XMLHttpRequest) takes provideHttpClient(withXhr()); that is why the request shows up as type Fetch under the Fetch/XHR filter.
Right-click a column header to add columns such as Protocol, Priority, Initiator and Remote Address. With Response Headers > Manage Header Columns you can add your own header column; a column for the X-Auth-Seen header our API returns shows at a glance that the interceptor ran on every request. Since Chrome 155–156 these custom header columns and their sort order survive a page reload.
The Filter box accepts more than plain text: method:OPTIONS, status-code:404, larger-than:100k, domain:localhost, mime-type:application/json, has-response-header:x-auth-seen, and is:running for open WebSockets. Several properties separated by spaces combine with AND; OR is not supported; to invert the filter, tick the Invert box next to it. The type buttons below the box (Fetch/XHR, Doc, CSS (Cascading Style Sheets), JS (JavaScript), Img…) do the same job in one click.
Recording stops and starts with Ctrl+E (Cmd+E). Preserve log keeps rows across page changes, as in the Console, and Disable cache turns off the HTTP (HyperText Transfer Protocol) cache while DevTools is open. Whether these two are on is the most common reason for seeing the same bug in two different ways.
Preflight, Authorization and Reading a CORS Error
The answer to the first question in Predict First is two rows. Their real values:
preflight: OPTIONS /api/books status=204 protocol=http/1.1 type=Preflight priority=High bytes=0
request: GET /api/books status=200 protocol=http/1.1 type=Fetch priority=High bytes=175992
   request Authorization: Bearer demo-token-42 | response X-Auth-Seen: yes
   preflight request headers: {"Access-Control-Request-Headers":"authorization","Access-Control-Request-Method":"GET","Origin":"http://localhost:4391"}
Because the origin differs and the request carries a "non-simple" header such as Authorization, the browser first asks for permission with an OPTIONS request. The preflight row's Headers tab shows Access-Control-Request-Headers: authorization, and its response shows the headers the API allows. Authorization appearing in the real request's Request Headers is proof that the interceptor ran; here X-Auth-Seen: yes also says the server received the header.
Now let's break it. We send a request to the same API with a header that is not allowed:
fetch('http://localhost:5391/api/books/3', { headers: { 'X-Trace-Id': 'abc-123' } })GET status=- failed=net::ERR_FAILED corsError={"corsError":"HeaderDisallowedByPreflightResponse","failedParameter":"x-trace-id"} allow-headers=-
OPTIONS status=204 failed=- corsError=null allow-headers=Authorization,Content-Type
console: [javascript/error] Access to fetch at 'http://localhost:5391/api/books/3' from origin 'http://localhost:4391' has been blocked by CORS policy: Request header field x-trace-id is not allowed by Access-Control-Allow-Headers in preflight response.The preflight succeeded (204), but x-trace-id is missing from the Access-Control-Allow-Headers list in its response. In the Network panel, the real GET row's Status column says "CORS error", meaning it failed a CORS (Cross-Origin Resource Sharing) check, and the Console message states the reason clearly. JavaScript only receives TypeError: Failed to fetch; for security reasons the browser does not hand the details to code. That is why you read a CORS error in DevTools, not in the application log. The fix is not in the frontend but in the ASP.NET Core policy:
builder.Services.AddCors(options =>
    options.AddPolicy("BookstoreWeb", policy => policy
        .WithOrigins(builder.Configuration["AllowedOrigin"] ?? "http://localhost:4391")
        .WithHeaders("Authorization", "Content-Type")
        .WithMethods("GET", "POST")));
Adding X-Trace-Id to WithHeaders is enough. CORS itself is explained in the Intermediate JavaScript series post "JavaScript Fetch API: GET, POST, response.ok, Timeouts and an Intro to CORS".
The Waterfall and Timing Phases
The Waterfall column draws each request as a bar on a time axis. Click a request and open the Timing tab to see the bar's phases as numbers. The API has an endpoint that waits 800 ms:
app.MapGet("/api/books/slow", async () =>
{
    await Task.Delay(800);
    return Results.Ok(new { message = "slow response" });
});
The timing values for this request, read from CDP (ms):
slow: GET /api/books/slow status=200 protocol=http/1.1 type=Fetch priority=High bytes=238
   timing ms {"stalled_until_dns":"0.2","dns":"0.3","connect":"0.2","ssl":"-","send":"0.0","waiting_ttfb":"803.1","content_download":"0.1","total":"803.9"}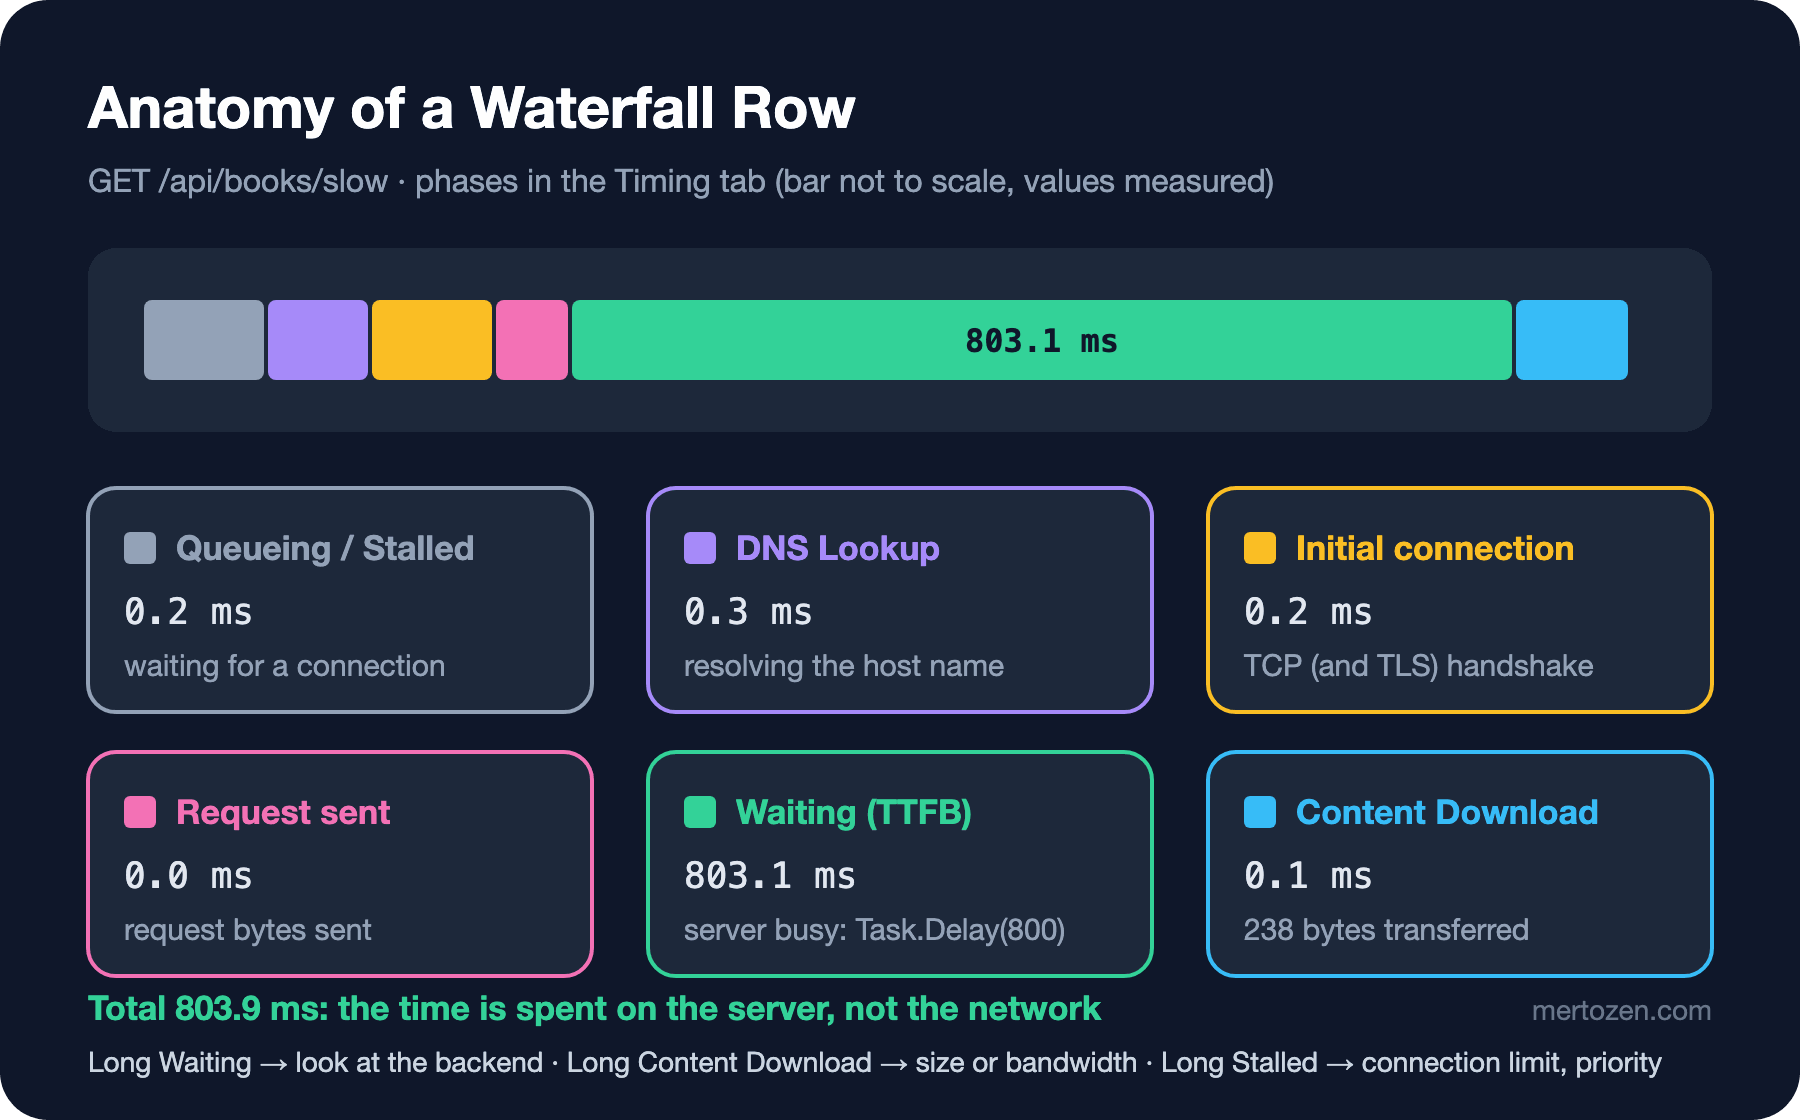
Reading the phases in order: Queueing and Stalled are the time the request waits for a connection or its turn; HTTP/1.1 opens at most six connections to the same origin, so this grows with many parallel requests. DNS (Domain Name System) Lookup resolves the host name, Initial connection is the TCP (Transmission Control Protocol) handshake, and over HTTPS (HTTP Secure) it includes TLS (Transport Layer Security) as well. Request sent is sending the request, Waiting (TTFB, Time To First Byte) is the time until the first byte arrives, and Content Download is downloading the response body. Of the 803.9 ms, 803.1 is in Waiting: the problem is not the network, it is the server. This is the first screen to show a teammate who says "the API is slow". What these phases mean at the protocol level is the subject of the upcoming "How Networking and HTTP Work" series.
Throttling, Offline and Request Blocking
The throttling menu at the top of the Network panel comes with No throttling, Fast 4G, Slow 4G, 3G and Offline; Custom > Add lets you define your own profile. We ran the same GET /api/books request (about 176 KB) without throttling and with a custom profile of 400 ms latency and 100 KB/s download:
throttle no throttling: fetch took 13 ms, transferred 175991 bytes, ttfb 0.6 ms, headers at 0.9 ms, finished at 2.6 ms
throttle custom 400ms latency, 100 KB/s: fetch took 2133 ms, transferred 175991 bytes, ttfb 0.6 ms, headers at 410.1 ms, finished at 2127.1 ms
The math checks out: 400 ms of latency pushes the headers to 410 ms, and downloading 175,991 bytes at 100 KB/s takes about 1.7 seconds. The list that arrives in 13 ms on localhost takes more than two seconds on a slow mobile connection. A measurement cannot make the cost of returning all 2000 books at once any clearer; the fix is paging or filtering on the server. Note: DevTools throttling is a browser-level emulation and does not imitate the packet loss and jitter of a real network.
With Offline selected, the request never leaves the browser:
offline fetch -> TypeError: Failed to fetch
   loadingFailed errorText: net::ERR_INTERNET_DISCONNECTED
Request blocking blocks a specific request: right-click it and choose Block request URL (Uniform Resource Locator) or Block request domain, or define patterns such as */api/books/slow in the Network request blocking tab of the Drawer. The request we blocked failed with blockedReason: inspector and showed up as a red row in the panel. It is the fastest way to test how the app behaves when a service is missing (does the spinner spin forever, does an error message appear).
Replaying and Mocking Requests: Copy as cURL, Edit and Resend, Local Overrides
Right-click a request and under Copy choose Copy as cURL, Copy as PowerShell, Copy as fetch or Copy as fetch (Node.js). Giving the backend team a cURL (client for URLs) command instead of saying "this request returns 500" lets them reproduce the error exactly on their machine. The copied command includes the Authorization header and cookies; clean out the token before sharing.
Edit and resend as fetch, added in Chrome 153–154, opens the request in the Console as an editable fetch() expression, with parameter descriptions as comments and a link to the original request. You no longer need to switch to Postman to change a query parameter or a body field and resend the request.
Local Overrides override the server's response locally. Right-click the request in Network and choose Override content or Override headers; the first time, you pick a folder where DevTools will write files and grant permission, and the edited response lives as a file under Sources > Overrides. Overridden requests are marked in the panel and can be found with the has-overrides:yes filter. Since Chrome 155–156, response body overrides persist across page navigations; 153–154 disabled overrides on non-http(s) schemes such as data: and blob:.
We tried the same idea with CDP's Fetch domain for book 9999, which does not exist in the API: we intercepted the GET to /api/books/9999, returned fake JSON (JavaScript Object Notation), and let the preflight through unchanged. The book detail page's output:
Fetch.requestPaused OPTIONS http://localhost:5391/api/books/9999
Fetch.requestPaused GET http://localhost:5391/api/books/9999
override -> h2: Mocked Volume | p: Grace Hopper · $99.00 · seen 1s
It is perfect for moving the frontend forward while the backend endpoint does not exist yet, or for trying an edge case such as "what does the button do when stock is 0" without changing server data. Keeping what you override compatible with the real API contract is your responsibility; forget to turn the override off and you will spend an hour debugging data that does not exist.
HAR: Before You Share
HAR (HTTP Archive) is a JSON record of all requests in the Network panel; it is the standard way to share "this is what happens on my machine" evidence with support or another team. You export with the download icon in the panel toolbar and import with the upload icon. Since Chrome 130 the default export is sanitized: the Export HAR (sanitized) and Copy all as HAR (sanitized) options leave the Cookie, Set-Cookie and Authorization headers out of the file. To export with sensitive data, turn on "Allow to generate HAR with sensitive data" under Settings > Preferences > Network; then the Export HAR (with sensitive data) option appears.
A sanitized export does not clean everything. Query strings in the URL, response bodies, custom headers such as X-Api-Key and form data stay in the file. Before attaching a HAR to a ticket, open it in a text editor and search for values such as tokens, email addresses and order numbers. Even in the Bookstore example, a sanitized HAR carries all 2000 books and the X-Auth-Seen header.
WebSocket and EventSource Messages
Long-lived connections are a single row in the Network panel, and the messages appear in a separate tab: Messages for WebSocket, EventStream for Server-Sent Events. We added an endpoint to the API that publishes stock updates with .NET 10's TypedResults.ServerSentEvents:
app.MapGet("/api/stock/stream", (CancellationToken ct) =>
    TypedResults.ServerSentEvents(StockUpdates(ct), eventType: "stock"));

static async IAsyncEnumerable<StockUpdate> StockUpdates([System.Runtime.CompilerServices.EnumeratorCancellation] CancellationToken ct)
{
    int[] bookIds = [3, 7, 12];
    for (int i = 0; i < 3 && !ct.IsCancellationRequested; i++)
    {
        await Task.Delay(300, ct);
        yield return new StockUpdate(bookIds[i], 10 - i);
    }
}
When we opened new EventSource('http://localhost:5391/api/stock/stream') on the page, these messages landed in the request's EventStream tab:
[EventStream] event=stock data={"bookId":3,"stock":10}
[EventStream] event=stock data={"bookId":7,"stock":9}
[EventStream] event=stock data={"bookId":12,"stock":8}
Each row shows the type (stock), the data and the time. When someone says "stock updates are not arriving" on the Angular side, look here first: if the message is here, the problem is in the component; if not, it is on the server or in the connection. For WebSockets, the Messages tab shows sent and received frames in different colors and has a filter box.
Production Notes
A time measured with Disable cache on does not represent a real user's repeat visit; measure with it on for the first-visit scenario and off for repeat visits, and write down which one you measured. In production the protocol will differ too: our local Kestrel speaks http/1.1, while behind a CDN (Content Delivery Network) the same request shows up as h2 or h3, and the Stalled phase behaves completely differently.
Copy as cURL, HAR files and screen sharing are the three most common ways tokens leak. Do not share a HAR captured with production tokens without checking it, even if it is sanitized. Local Overrides and request blocking only work in your browser; saying "I fixed it with an override" changes nothing the user sees.
Common Pitfalls
- Trying to fix a CORS error in the frontend: permission is granted by headers in the server's response.
- Missing the preflight row and filing a bug that says "the request is sent twice".
- Taking a long Waiting for a network problem: if the Timing tab puts the time on the server, a CDN or compression setting will not fix it.
- Leaving throttling on and wondering why everything is slow; the icon next to the Network tab shows a warning.
- Assuming a sanitized HAR is fully clean: query strings and bodies stay in the file.
- Leaving an override on and never seeing the real API's response.
A Small Experiment
★☆☆ Reload the Bookstore list with the Network panel open. Find the preflight with the method:OPTIONS filter, then add a header column for X-Auth-Seen and check that the column is still there after a reload.
★★☆ Open the Timing tab for /api/books/slow, then reduce Task.Delay to 200 ms and compare how the Waiting phase changes. Repeat the same request on Slow 4G and note which phases grow.
★★★ Use Local Overrides to set stock to 0 in the /api/books/3 response and watch how the detail page behaves. Then take a HAR with Export HAR (sanitized), and search the file to confirm there is no Authorization, and whether demo-token-42 appears anywhere else.
We have seen everything that goes to the server in the Network panel; but the data the browser keeps itself, namely localStorage, IndexedDB, cookies, Cache Storage and the Service Worker, is another panel's job. In the next post we open the Application panel: cookie flags, reading why a cookie was blocked, and diagnosing an Angular Service Worker that serves an old bundle after a deploy.