

The Memory Panel: Heap Snapshots, Allocation Timelines and Hunting Memory Leaks in Angular

In the Memory panel you prove a leak with the three-snapshot technique and find who holds it with the retainer chain: after 10 visits, 10 BookDetail instances remained, each holding 201 kB with a shallow size of 0.0 kB. A window resize listener, a shared closure context, an array in a service and an interval never unsubscribed; detached DOM holding the whole tree, shallow vs retained size, Chrome 155–156 context analysis and the fix with takeUntilDestroyed.
Version note: The examples in this post were run with Chrome 156 (156.0.8078.80), Angular 22.2 and .NET 10. Heap snapshots were taken with the same Chrome version in headless mode through the Chrome DevTools Protocol (CDP); the Summary, Comparison and retainer outputs come from the memory tools of chrome-devtools-mcp 1.12.0, which uses the DevTools heap snapshot engine. Panel steps come from the Chrome DevTools documentation.
Predict First
Bookstore's book detail page shows the time spent on the page, logs something when the window is resized, and registers itself with a "recently viewed" service:
export class BookDetail implements OnInit {
  readonly id = input.required<string>();
  protected readonly book = signal<Book | undefined>(undefined);
  protected readonly ticks = signal(0);
  private readonly books = inject(BookService);
  private readonly recentlyViewed = inject(RecentlyViewedService);
  private readonly largeCache = new Array(50_000).fill('review-text');

  ngOnInit(): void {
    this.books.getBook(Number(this.id())).subscribe(b => this.book.set(b));
    interval(1000).subscribe(() => this.ticks.update(t => t + 1));
    window.addEventListener('resize', () => this.onResize());
    this.recentlyViewed.register(this);
  }

  private onResize(): void {
    console.log('resize', this.largeCache.length);
  }
}
A user opens the details of ten different books and goes back to the list each time. Angular destroys the component every time. After garbage collection, how many BookDetail instances remain in memory? And how many times larger is the memory a BookDetail holds than its own size? How many separate leak sources do you see in this code?
The conceptual side of garbage collection and leaks is covered in the Advanced JavaScript series post "JavaScript Memory Management: Garbage Collection, Memory Leaks and WeakRef". This post is about the tool: how to prove and find a leak with the Memory panel.
Heap Snapshots: Summary, Comparison and Containment
In the Memory panel, choose Heap snapshot as the profiling type and press Take snapshot. DevTools first triggers a garbage collection, then dumps the JavaScript heap at that moment, together with the DOM (Document Object Model) objects connected to it, to a file. When the snapshot opens, you choose a view from the menu at the top. Summary groups objects by constructor name: _BookDetail, Array, (string) and so on. Comparison lists what was added, deleted and the difference for each constructor between two snapshots. Containment lets you walk the heap down from the roots, that is, from window and the garbage collection (GC) roots. Statistics is a summary of how memory is distributed.
Two columns in the Summary view are the heart of this panel: shallow size is the object's own size, and retained size is the total memory freed when that object is collected. The _BookDetail row in the snapshot taken after ten visits:
id,className,count,selfSize,retainedSize
109,_BookDetail,10,0.4 kB,2,009 kB
Ten instances, 0.4 kB of their own size in total, but 2 MB of memory held. Expand the row and the instances appear one by one:
nodeId,nodeName,type,distance,selfSize,retainedSize
2068547,_BookDetail,object,14,0.0 kB,201 kB
3644325,_BookDetail,object,14,0.0 kB,201 kB
A component whose own size rounds to 0.0 kB holds 201 kB. The object's outgoing edges tell where the difference comes from: the largeCache property is a 200 kB Array. That is why looking at shallow size and saying "the component is small, no problem" is misleading. The Distance column is how many steps the object is from a GC root; in a leak hunt, unexpected objects with a small distance are the first suspects.
The Three-Snapshot Technique
A single snapshot says "what is in memory", not "what is piling up". The classic method is three snapshots: take one at the start, repeat the suspect flow a few times, take a second snapshot, repeat the flow the same number of times, take a third. The difference between the first and second is warm-up (caches fill, lazy chunks load); what grows between the second and third in proportion to the number of repetitions is the leak. In Bookstore the flow is "open the details, go back to the list":
[leak] after 5 visits: BookDetail instances=5, usedJSHeapSize=33.2 MB
[leak] after 10 visits: BookDetail instances=10, usedJSHeapSize=34.2 MB
[leak] console after one resize: 10 resize logs
The instance count grows one-for-one with the visit count: none of them was collected. Resizing the window once drops ten lines into the console; ten destroyed components are still listening for events. You can also see the count from the console with queryObjects(BookDetail); we did the same with CDP's Runtime.queryObjects.
When you compare the second and third snapshots in the Comparison view, the first rows show noise such as (array), (compiled code) and PerformanceEventTiming; the browser's own records grow with every click too. To find the leak, type your own class name into the Class filter box, or sort the list by count delta and look for rows that are a multiple of the repetition count (5 here). In our comparison the total difference was +959 kB.
The Retainer Chain: Who Is Holding It?
Select an instance in the Summary view and the Retainers section below shows the references holding it; you follow the chain up to a GC root. The direct retainers of a leaked BookDetail:
name,type,nodeId,nodeName,selfSize,retainedSize
2,internal,2669907,(object elements),0.1 kB,0.1 kB
2,element,2669877,Array,0.0 kB,0.1 kB
this,context,2036839,system / Context / scope @1831819,0.0 kB,0.0 kB
There are two separate holders: element 2 of an array, and the this of a closure context. The context's path to a GC root (the shortest one, trimmed):
<- @2036839 system / Context / scope @1831819 via context this (distance: 13)
  <- @2036837  via internal context (distance: 12)
    <- @14804 V8EventListener via element 1 (distance: 11)
      <- @541048 EventListener via element 1 (distance: 10)
        <- @541050 blink::RegisteredEventListener via element 1 (distance: 9)
          ...
                <- @166322 blink::EventTargetData via element 1 (distance: 5)
                  <- @65059 Window / http://localhost:4391 via element 26 (distance: 4)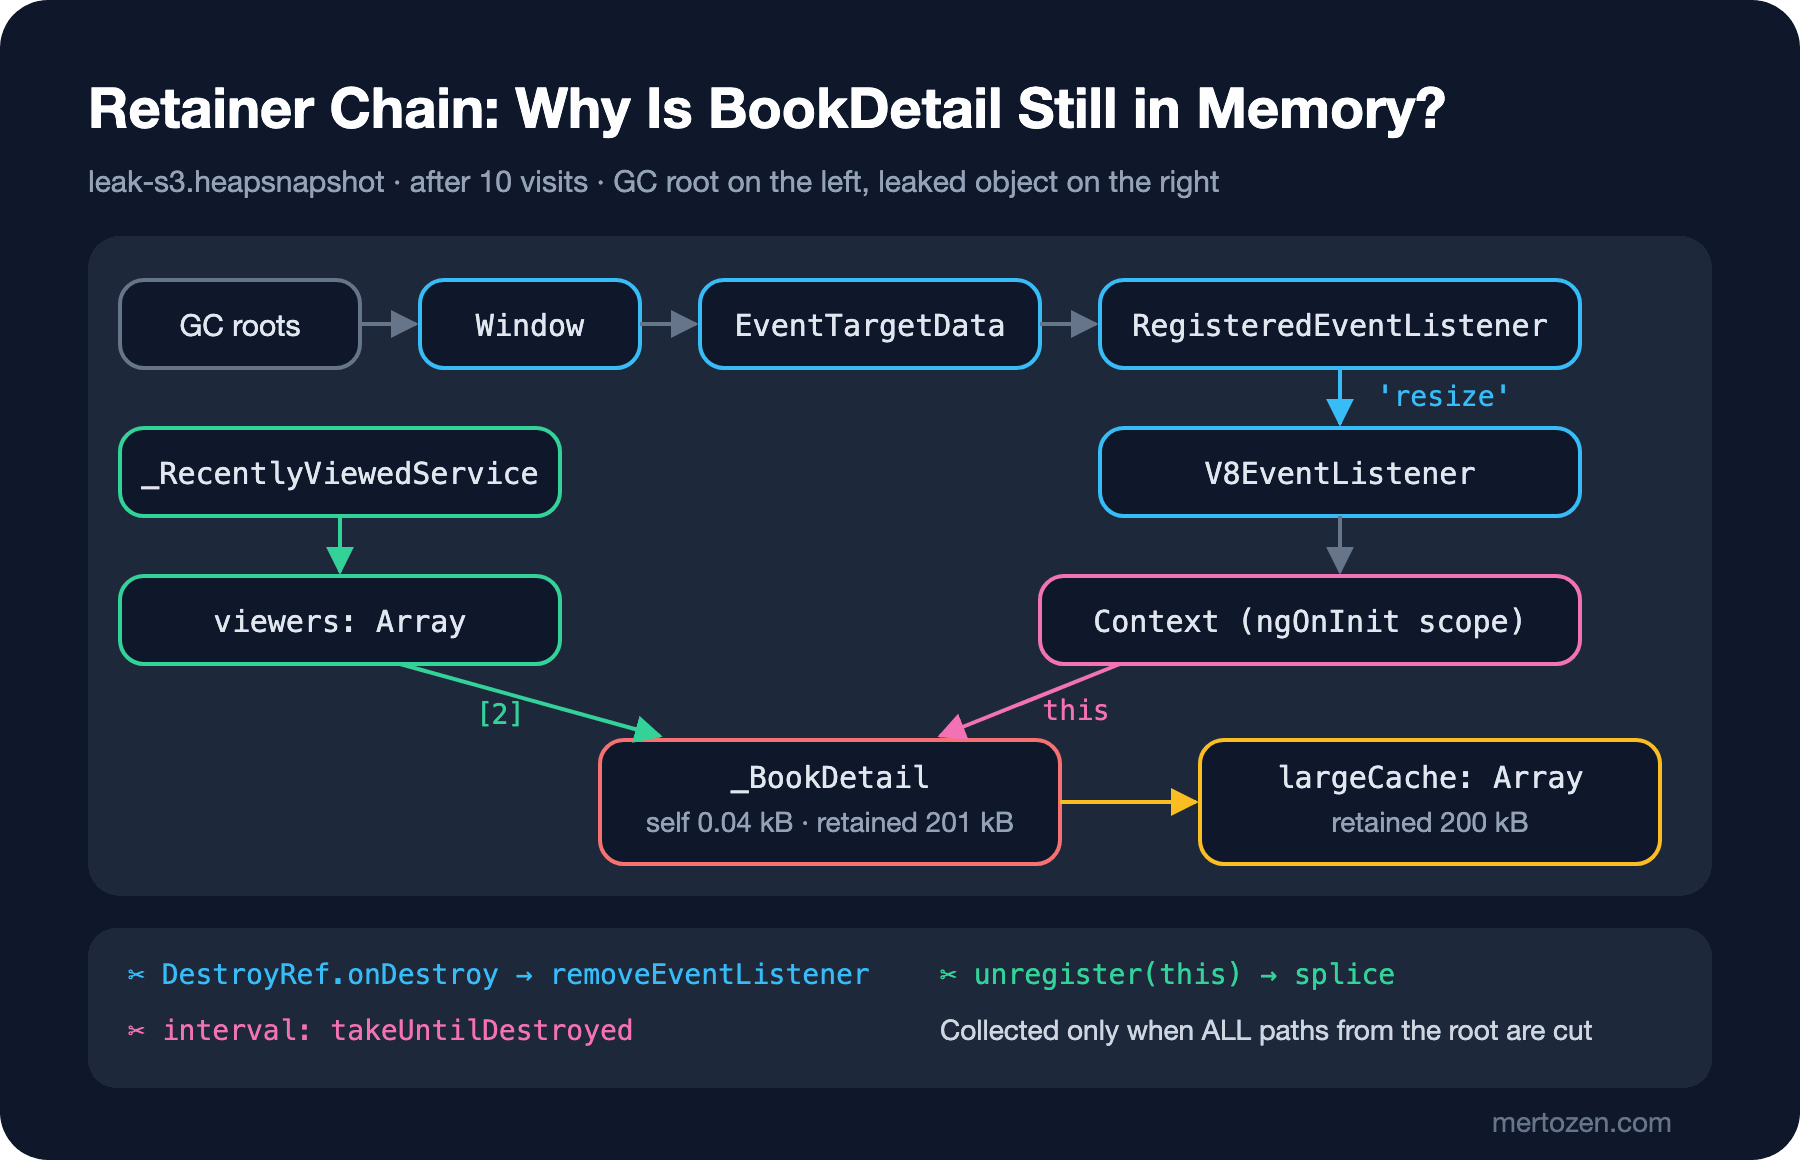
Read the chain from right to left: the Window's event listener list has a resize listener; the listener is an arrow function; the arrow function holds the scope (context) of ngOnInit; the context has this, which is the BookDetail. The array is RecentlyViewedService.viewers. An object is collected when every path from the root to it is cut; fix only one and the instance count does not change. That is why you must measure again after a fix.
The detail about the context matters. The two arrow functions in ngOnInit (the interval callback and the resize listener) are created in the same scope, so V8 (Chrome's JavaScript engine) gives them a single context. Fix the interval but forget the listener, and the context still lives and still holds this. Chrome 155–156 added an analysis for exactly this case: it reads the V8 scope information in the heap snapshot and lists, by memory impact, closure variables that are no longer used but are kept alive by a shared context. You see it by choosing "Objects retained by contexts" in the Summary view's filter menu. The same menu also has "Objects retained by detached DOM nodes", "Objects retained by the DevTools console" and "Objects retained by event handlers" filters.
Since Chrome 153–154, retainer and edge lists can be filtered by a minimum retained size and sorted by retained size, self size or name, and you can query snapshot objects directly by a retained size threshold or a property name. A corrupted snapshot file now shows a clear error instead of hanging the parser.
Detached DOM: One Reference Holds the Whole Tree
A detached DOM element is one that has been removed from the page but is still referenced from JavaScript. We fell into this ourselves while preparing the measurements for this post. Our first script waited for a book card on every visit and never released the element reference it got back. The comparison of the second and third snapshots:
index,className,addedCount,removedCount,countDelta,addedSize,removedSize,sizeDelta
0,Detached blink::UniqueElementData,60020,0,60020,6,722 kB,0.0 kB,6,722 kB
1,Detached Text,40020,0,40020,3,842 kB,0.0 kB,3,842 kB
2,Detached <span>,20000,0,20000,2,080 kB,0.0 kB,2,080 kB
3,Detached <button>,10000,0,10000,1,760 kB,0.0 kB,1,760 kB
6,Detached <app-book-card>,10000,0,10000,1,040 kB,0.0 kB,1,040 kB
Five references held over five visits meant 10,000 detached app-book-card elements: each reference holds a single card, but a detached element holds its parent, and the parent holds the whole subtree, so all 2000 cards in the list stay. The total difference was +22,429 kB; after releasing the references it dropped to +959 kB. In Angular the same thing happens with an ElementRef, a @ViewChild result or a document.querySelector result that you put into a service or a global variable. Typing Detached into the Summary view's Class filter box lists this kind of leak in one move.
Allocation Timeline and Allocation Sampling
A snapshot answers "what stayed"; for "when, and who allocated it" there are two other profiling types. Allocations on timeline shows memory allocated during the recording as bars on a timeline: blue bars are allocations still alive at the end of the recording, gray bars are ones that were collected. If a blue bar remains for every moment you went in and out of the details, the leak is there; select the bar and the objects allocated in that range and still alive are listed, with their allocation stacks. Allocation sampling takes low-cost samples and shows which functions allocate memory; it suits a long session or a production build better. In our example the owner of the allocations was obvious, so comparing snapshots was enough; but when "memory is growing and I do not know what grows", start with the timeline.
Four Classic Angular Leaks and Their Fixes
The code in Predict First had three sources; the fourth is about the cure for one of them:
- An observable that is never unsubscribed:
intervalis an infinite stream; the timer lives on after the component dies, and its callback holdsthis. - A global event listener: a listener added to
windowholds the component until it is removed. - A collection inside a service: a root service lives as long as the application; a component put into it is never collected.
- Subscribing by hand instead of using the
asyncpipe in the template: theasyncpipe andtoSignaltie the subscription to the component's lifetime; a hand-written subscription does not.
The fixed ngOnInit:
ngOnInit(): void {
  this.books.getBook(Number(this.id())).subscribe(b => this.book.set(b));
  interval(1000)
    .pipe(takeUntilDestroyed(this.destroyRef))
    .subscribe(() => this.ticks.update(t => t + 1));
  const onResize = () => this.onResize();
  window.addEventListener('resize', onResize);
  this.recentlyViewed.register(this);
  this.destroyRef.onDestroy(() => {
    window.removeEventListener('resize', onResize);
    this.recentlyViewed.unregister(this);
  });
}
takeUntilDestroyed ties the subscription to DestroyRef; the listener's reference is kept in a variable so the same function can be removed; and the service got an unregister. We left the HTTP (HyperText Transfer Protocol) request's subscription alone: the HttpClient observable completes when the response arrives. The same measurement after the fix:
[fixed] after 5 visits: BookDetail instances=0, usedJSHeapSize=32.2 MB
[fixed] after 10 visits: BookDetail instances=0, usedJSHeapSize=32.3 MB
[fixed] console after one resize: 0 resize logs
Zero instances. Storing only the data you need (such as the book id) in the service instead of the component is an even better design; takeUntilDestroyed was first covered in the Angular series post "What's New in Angular 16: Signals, Required Inputs and takeUntilDestroyed".
Production Notes
Take snapshots in a development build: class names are readable (_BookDetail), while in production you deal with minified names (Tr, pa). But confirm absolute numbers in the production build. Snapshot files are large; our dev build snapshots were between 100 and 122 MB, and they can contain every string on the page, which means user data and tokens. Keep that in mind before sharing one.
While measuring, your own tools become retainers too. Objects you log to the console, queryObjects results and temp1 variables created with Store as global variable are held by the DevTools console. In one of our intermediate runs, "DevTools console" showed up at the top of the retainer list; the cause was our own counting query. Clear the console before measuring.
There is no Memory panel on the user's machine. To notice memory growth in a long-lived tab there are APIs (Application Programming Interface) such as performance.measureUserAgentSpecificMemory() and RUM (Real User Monitoring) metrics; but the diagnosis still happens here, locally, with a repeatable flow.
Common Pitfalls
- Clearing an object because its shallow size looks small; look at retained size.
- Deciding from a single snapshot: you need three snapshots to tell warm-up from a leak.
- Cutting one retainer path and declaring "fixed" without measuring; the other paths keep holding the object.
- Forgetting the shared closure context: another callback in the same scope keeps
thisalive. - Mistaking console logs,
tempvariables and a test tool's element references for leaks. - Writing the arrow function again inside
removeEventListener: it is a different function, so the listener stays.
A Small Experiment
★☆☆ Take a snapshot in a development build and type BookDetail into the Class filter. Open the details three times, take a second snapshot, and read the count delta of the _BookDetail row in the Comparison view.
★★☆ Add only takeUntilDestroyed and leave the listener and the service registration as they are. Repeat the three-snapshot technique and show from the retainer chain why the instance count does not change. Then look at the "Objects retained by contexts" filter.
★★★ Rewrite RecentlyViewedService so it keeps only book ids instead of components. Record with Allocations on timeline while going in and out of the detail page five times; find what the blue bars left at the end of the recording belong to, and compare with a recording taken before the fix.
Memory is clean and interactions are fast; but who measures this, and which number should you trust? In the next post we cover reading Lighthouse 13's audits correctly, the difference between lab and field data, the Rendering tab's emulations, and using Coverage to find @defer and lazy route candidates in the Angular bundle.