

Load Balancing: L4 vs L7, Algorithms, Health Checks and Sticky Sessions
A load balancer's algorithm decides the latency users see when one instance slows down: in a real YARP experiment round robin pushes p99 to 4.6 seconds, while LeastRequests and power of two choices cut traffic to the slow instance by themselves and keep p99 at 300 ms. Only a health check removes a crashed instance (133 errors down to 35); the post also covers L4 vs L7, the cost of sticky sessions, connection draining and global load balancing with GeoDNS and anycast.
Version note: The code in this post was built and run with C# 14 and .NET 10; the load balancer example ran with YARP (Yet Another Reverse Proxy) 2.3.0.
Guess First
Bookstore's catalog API (Application Programming Interface) now runs on three instances, with a load balancer in front that hands out requests in turn. Each instance finishes a search in 20 ms and can handle at most 8 requests at the same time. One day one of the instances slows down because of another workload on the same machine: the same search now takes 300 ms. The other two are perfectly healthy. The load balancer receives 200 requests per second.
Roughly what p99 latency do users see: 20 ms, 300 ms, or something much worse? And does changing the load balancer's algorithm fix it?
What Does a Load Balancer Do?
A load balancer (LB) is the component that spreads incoming requests or connections across a group of servers. In the previous post, "From One Server to Millions of Users: Vertical and Horizontal Scaling and the Stateless Tier", we made the application tier stateless; the load balancer is the part that presents those stateless instances to the outside as a single address. It has three jobs: spreading the load, taking unhealthy instances out of traffic, and hiding instances being added and removed from the client.
The load balancer itself is a point of failure too. That is why it usually runs as a pair (active-passive or active-active) or comes as a managed service from the cloud provider, whose availability is the provider's responsibility. A single Nginx you set up yourself wipes out the availability gain of the three instances behind it.
L4 and L7 Load Balancers
Load balancers fall into two groups depending on which layer of the OSI (Open Systems Interconnection) model they decide at:
An L4 (Layer 4) load balancer works at the TCP (Transmission Control Protocol) or UDP (User Datagram Protocol) level: it looks at the IP (Internet Protocol) address and port, does not look inside the packet, and sends all packets of a connection to the same server. An L7 (Layer 7) load balancer reads the HTTP (Hypertext Transfer Protocol) request; it can send requests starting with /api/ to the API instances and those starting with /images/ to another group. To do that it has to terminate the TLS (Transport Layer Security) connection.
| Criterion | L4 (transport layer) | L7 (application layer) |
|---|---|---|
| Looks at | IP address and port, TCP/UDP connection | The HTTP request: path, host, headers, cookies |
| Distributes | Connections | Requests |
| TLS | Usually leaves it alone, forwards encrypted traffic | Terminates it (TLS termination), reads the content |
| Can do | Very fast, protocol-agnostic | Path-based routing, retries, adding headers, sticky cookies |
| Examples | Azure Load Balancer, AWS (Amazon Web Services) Network Load Balancer | Azure Application Gateway, AWS Application Load Balancer, Nginx, YARP |
The most important difference in practice: L4 distributes connections, not requests. With long-lived connections that carry many requests, like HTTP/2 or gRPC, all requests of a client go to a single instance; newly added instances get no load at all until existing connections close. If you want balancing per request you need L7.
Algorithms
Round robin picks the next instance in turn. It is simple and fair, but it assumes all instances and all requests are equal. Weighted round robin gives instances weights and sends more requests to the stronger machine. Least connections (LeastRequests in YARP) picks the instance with the fewest active requests at that moment; because requests pile up on a slow instance, it naturally gets less work. Least response time combines the active request count with measured response time.
Power of two choices picks two instances at random and sends to the less busy one. The result known from Michael Mitzenmacher's work is that, compared to purely random choice, the load on the busiest server drops dramatically, without having to scan all instances. YARP's documentation explains choosing it as the default policy on the same grounds: avoiding the cost of LeastRequests examining every destination and the risk of Random picking a busy one.
Hash-based algorithms take a hash of some property of the request (client IP, user id, URL (Uniform Resource Locator)) and always send it to the same instance. The goal is not balance but locality: keeping the same user's data warm in that instance's cache. A plain hash % N breaks almost every mapping when the number of instances changes; the fix is in the series' post "Consistent Hashing: Hash Rings, Virtual Nodes and a C# Implementation".
The "Load Balancing in the Datacenter" chapter of Google's SRE (Site Reliability Engineering) book adds two more details. The first is subsetting: thousands of clients opening connections to thousands of backends costs memory and health checks, so each client connects only to a subset (typically 20–100 backends), and choosing that subset deterministically keeps the load even. The second is the trap of the "fewest active requests" signal: if a broken backend rejects requests very fast, it always appears to have few active requests and pulls in traffic like a black hole. The book calls this sinkholing and suggests counting recent errors as active requests too.
Experiment: One Slow Instance
Let's build the opening scenario with YARP. YARP is Microsoft's open-source reverse proxy library built on ASP.NET Core; we can change its load balancing policies and health checks through configuration. First the three backend instances. Each handles at most 8 requests at a time, the rest wait in line:
sealed class BackendInstance(string name, int port, TimeSpan serviceTime)
{
    private readonly SemaphoreSlim _workers = new(8);
    private WebApplication? _app;

    public async Task StartAsync()
    {
        WebApplicationBuilder builder = WebApplication.CreateBuilder();
        builder.WebHost.UseUrls($"http://localhost:{port}");
        builder.Logging.ClearProviders();
        _app = builder.Build();
        _app.MapGet("/health", () => "ok");
        _app.MapGet("/api/books/search", async () =>
        {
            await _workers.WaitAsync();   // when capacity is full the request waits in line
            try { await Task.Delay(serviceTime); }
            finally { _workers.Release(); }
            return name;
        });
        await _app.StartAsync();
    }

    public Task StopAsync() => _app!.StopAsync();
}
On the proxy side the cluster's policy comes from the command line:
ClusterConfig[] clusters =
[
    new()
    {
        ClusterId = "bookstore-api",
        LoadBalancingPolicy = policy,
        Destinations = new Dictionary<string, DestinationConfig>
        {
            ["api-1"] = new() { Address = "http://localhost:5201" },
            ["api-2"] = new() { Address = "http://localhost:5202" },
            ["api-3"] = new() { Address = "http://localhost:5203" },
        },
    },
];
builder.Services.AddReverseProxy().LoadFromMemory(routes, clusters);
The load generator is open-loop: a new request every 5 ms without waiting for the previous one to finish, so 200 requests per second, 600 requests over 3 seconds. Real traffic arrives like this too; users don't know the system has slowed down and wait.
// open-loop load: one request every 5 ms (~200 per second) for 3 seconds
for (int i = 0; i < 600; i++)
{
    if (scenario == "crash" && i == 200) _ = backends[2].StopAsync();   // api-3 crashes at second 1
    inFlight.Add(SendAsync());
    TimeSpan next = TimeSpan.FromMilliseconds(5 * (i + 1));
    if (next > clock.Elapsed) await Task.Delay(next - clock.Elapsed);
}
await Task.WhenAll(inFlight);
The real output of the three policies with api-3 slowed down to 300 ms:
== slow, RoundRobin
api-1: 200 requests
api-2: 200 requests
api-3: 200 requests
errors: 0, p50 21 ms, p99 4,652 ms
== slow, LeastRequests
api-1: 249 requests
api-2: 319 requests
api-3:  32 requests
errors: 0, p50 21 ms, p99 303 ms
== slow, PowerOfTwoChoices
api-1: 282 requests
api-2: 283 requests
api-3:  35 requests
errors: 0, p50 21 ms, p99 301 ms
The answer to the opening guess is in the first block: with round robin p99 is 4.6 seconds. We can do the math on paper too. Round robin sends ~67 requests per second to api-3; api-3's capacity is 8 ÷ 0.3 s ≈ 27 requests per second. Since more arrives than can be processed, the line grows by ~40 requests every second, and by the end of the test a request in line waits for seconds. One third of the instances is unhealthy, but one third of the requests is punished; that is also why p50 staying at 21 ms is misleading.
LeastRequests and PowerOfTwoChoices sent only 32 and 35 requests to the same slow instance. As requests piled up on api-3 its active request count went up and the algorithm moved the traffic to the other two by itself; p99 dropped to the slow instance's own service time (300 ms). Power of two choices did this by looking at only two instances per request. The load balancer needed no health check or configuration change to notice the slowness; the algorithm itself is the feedback loop.
Health Checks: Active and Passive
The algorithm handled the slow instance; it won't handle a dead one. Health checks come in two forms. With an active health check the load balancer periodically sends a request to an endpoint on each instance (/health) and removes the one that fails several times in a row. With a passive health check it watches real traffic: an instance whose connection error or 5xx rate passes a threshold is left out for a while. YARP supports both:
HealthCheck = new HealthCheckConfig
{
    Active = new ActiveHealthCheckConfig
    {
        Enabled = true,
        Interval = TimeSpan.FromMilliseconds(500),
        Timeout = TimeSpan.FromMilliseconds(300),
        Policy = HealthCheckConstants.ActivePolicy.ConsecutiveFailures,
        Path = "/health",
    },
},
Let's change the scenario: this time all three instances are fast, but at the 200th request (about second 1) api-3 shuts down completely. Round robin, with and without a health check:
== crash, RoundRobin
api-1: 200 requests
api-2: 200 requests
api-3:  67 requests
errors: 133, p50 21 ms, p99 43 ms
== crash, RoundRobin + active health check
api-1: 249 requests
api-2: 249 requests
api-3:  67 requests
errors: 35, p50 21 ms, p99 24 ms
Without a health check, one in three requests after api-3 crashed got an error: a third of 400 requests, 133 errors. YARP returned 502 to the client for the destination it could not connect to. With the active health check the error count went down to 35: two consecutive failed checks at a 500 ms interval, so within about a second api-3 left the list and the remaining requests went to api-1 and api-2. It did not reach zero, because an active health check is delayed by nature; a shorter interval gets closer to zero but means more check requests on healthy instances too. In practice the two are used together: the passive check sees errors in real traffic right away, the active check finds out whether the instance has come back.
What the health endpoint checks is a design decision too. Removing an instance that cannot reach the database looks sensible, but if the database is down for everyone, all instances leave the list at once and the load balancer has nobody left to send to. The liveness vs readiness split is in the ASP.NET Core Web API series post "Health Checks in ASP.NET Core Web API: Liveness, Readiness and Database Checks"; load balancers usually look at readiness.
The Cost of Sticky Sessions
Sticky sessions (session affinity) mean the load balancer always sends the same client to the same instance: with a cookie at L7, with a hash of the client IP at L4. In the previous post we saw that a stateless tier makes them unnecessary; this post's experiment shows their cost as well. With affinity on, if a user is pinned to api-3 the load balancer cannot steer them away from the slow instance: the whole gain of LeastRequests is gone for sticky users. The load also spreads unevenly, because users are not equal; a heavy corporate customer sticks to a single instance. And when the instance crashes or goes down for a deployment, those users' in-memory state is gone.
Affinity has legitimate uses: benefiting from a warm cache in the instance's memory, or traffic that is tied to a connection by nature, like WebSockets. Even then affinity should be an optimisation, not a condition for correctness: when a user lands on another instance the system should get slower, not break.
Connection Draining and Deployments
When taking an instance down for a deployment you don't want to cut its requests in half. Connection draining means marking the instance so it receives no new requests and waiting for existing requests to finish. On AWS target groups this is called the deregistration delay and defaults to 300 seconds; Google's SRE book describes a similar state as "lame duck": the task still serves requests but tells clients to stop sending new ones.
On the ASP.NET Core side the counterpart is graceful shutdown: when the host receives SIGTERM it stops accepting new connections and waits up to HostOptions.ShutdownTimeout (30 seconds by default) for existing requests to finish. The two durations have to fit together: if the load balancer's draining period is short, or the instance shuts down before the load balancer takes it out of the list, every rolling deployment drops a few hundred requests with 502.
Global Load Balancing: GeoDNS, Anycast and DNS TTL
With more than one region the decision is made at two levels: first which region, then which instance in that region.
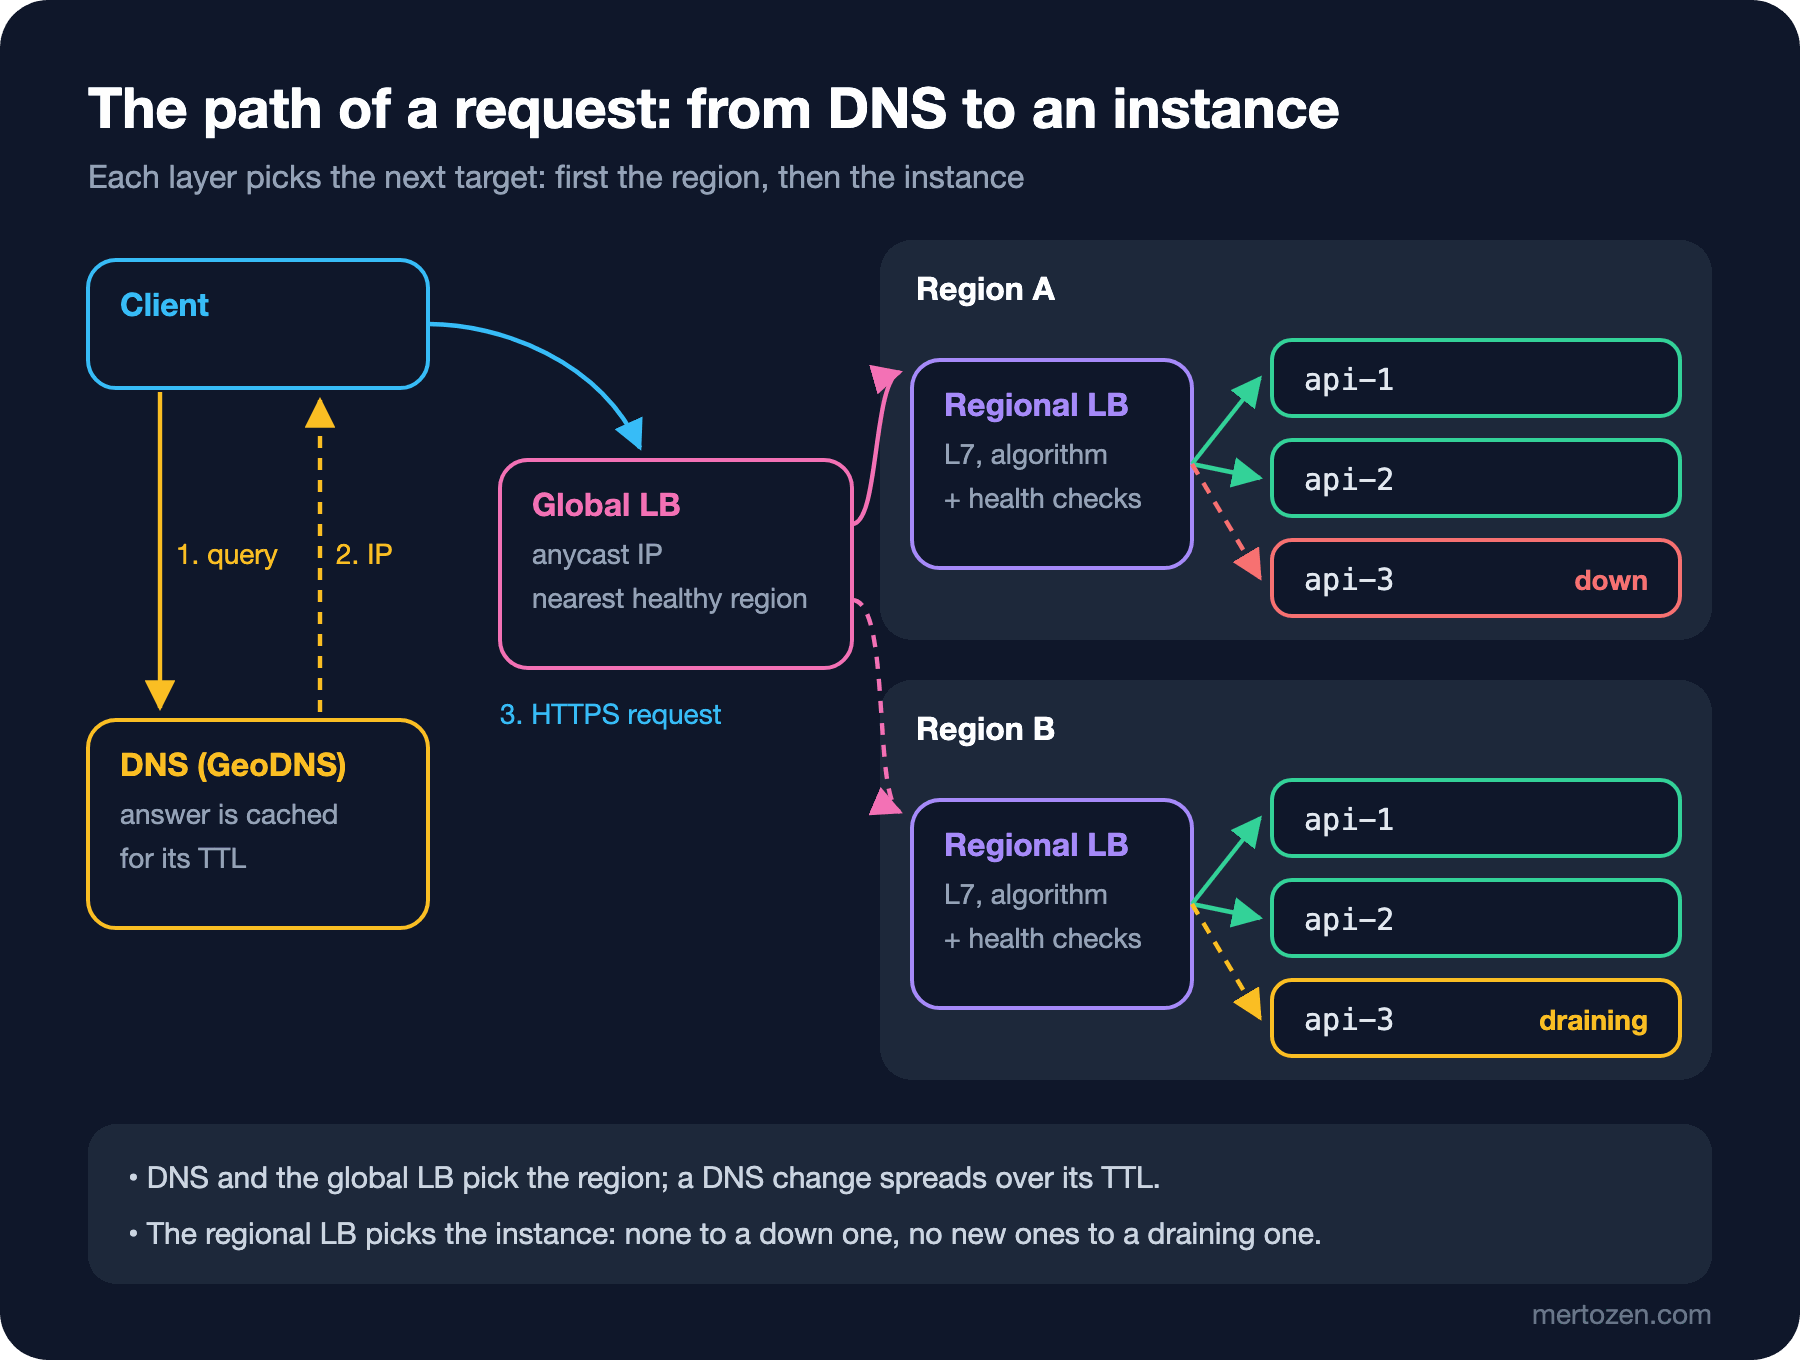
The most common way to choose the region is DNS (Domain Name System). GeoDNS returns a different IP address for the same name depending on where the query comes from: a user in Europe gets Frankfurt, a user in Türkiye gets the nearest region. Its problem is TTL (time to live): the DNS answer is cached in resolvers and clients for the TTL, and some don't even respect it. Even if you change DNS when a region goes down, some users keep going to the dead region until the TTL expires. A shorter TTL (like 60 seconds) speeds up propagation, but increases the number of DNS queries and resolution latency.
Anycast skips this delay: the same IP address is announced from many locations through BGP (Border Gateway Protocol), and internet routing takes the packet to the nearest location. When a location goes down the announcement is withdrawn and traffic flows to the next one within seconds; the client's DNS cache never changes. The global load balancers of the big cloud providers and CDNs (Content Delivery Network) work this way. Since it is hard to build yourself, it is usually used as a managed service.
For Bookstore this layer is unnecessary today; one region is enough. But knowing about DNS TTL helps even in one region: in a migration where the load balancer's IP changes, the old record lives on for the TTL. DNS and CDN setup are the topic of the upcoming Domain, DNS and CDN series in the DevOps category, and Nginx configuration of the Web Servers and Hosting series.
Common Pitfalls
Treating all instances and requests as equal. Round robin punishes a third of the requests when one instance slows down; the 4.6-second p99 above is the measure of it.
Tying the health check to the database. When a shared dependency goes down, all instances leave the list at once; the load balancer completely shuts down a system that is healthy but unable to work.
Mistaking a fast-failing instance for a healthy one. "Fewest active requests" logic piles traffic onto an instance that rejects requests instantly; take the error rate into account in the passive health check.
Balancing HTTP/2 and gRPC at L4. Because of long-lived connections, the load stays distributed the way it was when the connections opened.
Deploying without draining. If an instance shuts down before leaving the load balancer, every deployment shows up to users as a few seconds of 502.
Leaving the load balancer itself single. A single proxy in front of three instances ties the system to a single point of failure again.
A Small Experiment
★☆☆ Run the slow scenario with the Random policy. How many requests went to api-3, and what was p99? Compare the result with round robin and power of two choices.
★★☆ Raise the active health check's Interval from 500 ms to 2 seconds and predict the error count in the crash scenario, then measure it. Then turn on YARP's passive health check (Passive = new PassiveHealthCheckConfig { Enabled = true }) and look at how the two behave together.
★★★ Turn api-3 into an instance that rejects every request immediately with 500 instead of being slow, and run it with LeastRequests. Can you see the sinkholing the Google SRE book describes? How would you prevent it with the passive health check or your own ILoadBalancingPolicy implementation?
The load balancer spread the load, but every instance still sends the same queries to the same database. In the next post we look at the layer that cuts that repetition: caching strategies, from cache-aside to write-behind, and cache stampede, where on campaign day the cache itself turns into a source of load.