

Connection Pooling in Depth: the ADO.NET Pool, Pool Exhaustion, Npgsql and PgBouncer
The "max pool size was reached" error almost never comes from a small pool but from connections that don't come back; the fix is finding the leak and calculating the instances × pools × Max Pool Size budget. The SqlClient pool key and counters, fragmentation into 50 pools via Application Name, PostgreSQL's 53300 error, PgBouncer carrying 250 clients on 20 connections at 5.5 times the throughput, SET leaking in transaction mode, and max_prepared_statements.
Version note: The examples in this post were built and run in a single-machine lab with .NET 10, Microsoft.Data.SqlClient 7.1.2, Npgsql 10.0.3, SQL Server 2025 (CU10), PostgreSQL 18.7 and PgBouncer 1.26.1. Timings belong to this lab; the ratios and error messages are what matter.
Guess First
An endpoint written for Bookstore, the online bookstore used as the shared example across this site's series, returns the number of pending orders. Whoever wrote it opened the connection and ran the query but forgot the using. We deliberately kept the pool small: at most 5 connections, a 3-second timeout while waiting for one.
SqlConnectionStringBuilder builder = new(Db.Env("BOOKSTORE_SQL"))
{
    MaxPoolSize = 5,
    ConnectTimeout = 3,
    ApplicationName = "Bookstore.Api"
};
string connectionString = builder.ConnectionString;

for (int request = 1; request <= 7; request++)
{
    // no using: the connection never goes back to the pool
    SqlConnection connection = new(connectionString);
    await connection.OpenAsync();
    await new SqlCommand("SELECT COUNT(*) FROM dbo.Orders WHERE Status = 'Pending'", connection).ExecuteScalarAsync();
}
Seven requests arrive one after another. The server is fine and the query is fast. Which request fails, after how long, with which error? And how many sessions does SQL Server have at that moment?
request 1: ok in 174 ms
request 2: ok in 88 ms
request 3: ok in 86 ms
request 4: ok in 87 ms
request 5: ok in 87 ms
request 6: InvalidOperationException after 3004 ms
  Timeout expired.  The timeout period elapsed prior to obtaining a connection from the pool.  This may have occurred because all pooled connections were in use and max pool size was reached.
request 7: InvalidOperationException after 3000 ms
  Timeout expired.  The timeout period elapsed prior to obtaining a connection from the pool.  This may have occurred because all pooled connections were in use and max pool size was reached.
server: program=Bookstore.Api status=sleeping open_tran=0 sessions=5
The sixth request waited exactly Connect Timeout and threw an InvalidOperationException. The server has 5 sessions, all sleeping: the database is idle while the application waits for a connection. This is the most common failure on the second rung of the ladder. When the same code runs with await using, all seven requests succeed: the first takes 167 ms, the rest 10–12 ms, because after the first one every request reuses the same physical connection from the pool. The ~75 ms difference is what opening a new physical connection (TCP, TLS setup and login) costs in this lab.
How Does the ADO.NET Pool Work?
SqlConnection.Open actually asks a pool for a usable connection; Close, Dispose or DisposeAsync returns it to the pool. Before handing a connection to another user, the pool resets its session state. Pooling is on by default; the application's job is to follow the "open late, close early" rule.
A pool is not determined by the server address alone. According to the Microsoft.Data.SqlClient documentation, the pool key consists of the exact text of the connection string (two strings with different keyword order are two pools), the identity under Windows authentication, the SqlCredential object itself, the AccessToken value, or the AccessTokenCallback delegate instance. Code that creates a new callback lambda or a new SqlCredential per request opens a new pool per request.
| Setting | Default | What it does |
|---|---|---|
Max Pool Size | 100 | Maximum physical connections in the pool |
Min Pool Size | 0 | Connections kept open even when idle |
Connect Timeout | 15 s | How long Open waits when the pool is full |
Load Balance Timeout | 0 | Maximum age of a connection returned to the pool |
Connection Idle Timeout | 300 s | New in 7.1; when an idle connection is evicted (opt-in) |
By default the pool closes unused connections above Min Pool Size after roughly 4–8 minutes; the documentation describes this as implementation behavior, not a guarantee. 7.1 brought two opt-in changes: enforcing Connection Idle Timeout requires setting the Switch.Microsoft.Data.SqlClient.UseLegacyIdleTimeoutBehavior switch to false, and the new channel-based pool (V2) is enabled with Switch.Microsoft.Data.SqlClient.UseConnectionPoolV2. Both are off by default; try them under your own load test before turning them on.
The pool also clears itself: when it sees a fatal error showing the connection to the server is gone (such as a failover), it clears the affected pool, closes idle connections and discards in-use ones when they come back. We'll measure what that means during a failover in post 05.
Diagnosing Pool Exhaustion
The "max pool size was reached" message is a consequence; its cause is almost never "the pool is too small". It means connections aren't coming back to the pool, or come back late. Possible causes:
- Connections, commands or readers that aren't disposed (the example above). As long as a
SqlDataReaderstays open, its connection stays busy. - Long transactions: in particular, a connection opened inside an ambient
TransactionScopedoesn't return to the general pool until the transaction ends. - Slow queries or blocking: each request holds its connection longer; even with the same traffic, the number of connections needed grows.
- Genuinely too much concurrency: if more than 100 requests hit one instance at once, the conversation is about instance count or query duration, not the pool.
Look from both sides to tell them apart. On the server, sys.dm_exec_sessions shows the application's sessions. If they are all sleeping with open_transaction_count at 0, there is a leak (connections are held by the application but do no work). Sleeping sessions with open_transaction_count above 0 mean uncommitted transactions, the most dangerous case because they hold locks. running or suspended sessions point to slow queries or blocking; the rest of that diagnosis is in the SQL Server Deep Dive series post "A Diagnostic Method". On the application side, SqlClient has counters.
A note: AddDbContextPool in EF Core is not connection pooling. It reduces object creation cost by reusing DbContext instances; the connections underneath still come from the SqlClient or Npgsql pool. The difference is covered in the EF Core series post "EF Core in ASP.NET Core: AddDbContext, Scoped Lifetime, Factory and Pooling".
Pool Fragmentation and SqlClient Counters
A team working on Bookstore's institutional customers wanted to see in SQL Server which institution's query was slow, so they added the institution number to Application Name. We measure the effect of this innocent-looking change with SqlClient's event counters. They are published through Microsoft.Data.SqlClient.EventSource and can be read in-process with an EventListener:
public sealed class SqlClientCounterListener : EventListener
{
    public ConcurrentDictionary<string, double> Latest { get; } = new();

    protected override void OnEventSourceCreated(EventSource eventSource)
    {
        if (eventSource.Name == "Microsoft.Data.SqlClient.EventSource")
        {
            // counters aren't published without EventCounterIntervalSec
            EnableEvents(eventSource, EventLevel.Informational, EventKeywords.None,
                new Dictionary<string, string?> { ["EventCounterIntervalSec"] = "1" });
        }
    }

    protected override void OnEventWritten(EventWrittenEventArgs eventData)
    {
        if (eventData.EventName != "EventCounters" || eventData.Payload is null)
        {
            return;
        }
        foreach (object? item in eventData.Payload)
        {
            if (item is IDictionary<string, object> counter && counter.TryGetValue("Name", out object? name))
            {
                object value = counter.TryGetValue("Mean", out object? mean) ? mean : counter["Increment"];
                Latest[(string)name] = Convert.ToDouble(value);
            }
        }
    }
}
For 50 institutions we open and close connections in parallel, three rounds each; first with a separate Application Name per institution, then with a single fixed value:
SqlConnectionStringBuilder builder = new(Db.Env("BOOKSTORE_SQL"))
{
    ApplicationName = canonical ? "Bookstore.Api" : $"Bookstore.Api-tenant-{tenant}"
};
number-of-active-connection-pool-groups 50
number-of-active-connection-pools 50
number-of-pooled-connections 50
number-of-free-connections 50
number-of-active-connection-pool-groups 1
number-of-active-connection-pools 1
number-of-pooled-connections 7
number-of-free-connections 77 physical connections instead of 50 for the same work. The gap grows with the number of institutions: in a system with 2,000 institutions, each instance can hold 2,000 separate pools and at least 2,000 physical connections, along with the memory the server spends per session and the login cost. The right way to carry the institution's identity into the query is not the connection string but sp_set_session_context or OpenTelemetry traces. With a separate database per institution (database-per-tenant), the pool count is unavoidably the database count; write that into the capacity plan. The other sides of that model are in the Solution Patterns series post "Data Isolation in Multi-Tenancy".
In production you can look at the same counters without changing the application, using dotnet-counters monitor --counters Microsoft.Data.SqlClient.EventSource -p <pid>. Watch hard-connects (physical connections opened per second; if it stays high, the pool isn't doing its job), number-of-active-connection-pools (fragmentation), number-of-stasis-connections and number-of-reclaimed-connections (connections collected by the garbage collector without being disposed; a sure sign of a leak).
The Total Connection Budget
A pool belongs to a process; it isn't shared across instances. The maximum number of connections the database will see is a simple product: instance count × pools per instance × Max Pool Size per pool. With Bookstore.Api running on 3 pods in Kubernetes, that's 300. If on a campaign day the HPA raises the pod count to 12, it's 1,200. Add the background jobs, the reporting service and the migration tool if they connect to the same server. How the HPA works is in the Kubernetes series post "Scaling in Kubernetes"; what matters here is that the pod count is also a connection multiplier.
SQL Server's limit is high (SELECT @@MAX_CONNECTIONS returned 32767 in this lab), but every session uses memory and worker threads; those resources are usually the real limit. In PostgreSQL max_connections is kept low because every connection is a separate backend process. The lab's PostgreSQL runs with max_connections = 200. We load it from a single process with 250 concurrent clients, opening the Npgsql pool up to 300:
db=pg concurrency=250 requests=91981 errors=327
throughput=6062.1 req/s p50=7.6 ms p95=227.1 ms p99=349.7 ms
first error: PostgresException: 53300: sorry, too many clients already
327 requests failed without getting a connection and p95 rose to 227 ms. This is a small rehearsal of the 12-pod campaign day. Running the same load with the Npgsql pool capped at 20 changes the picture:
db=pg concurrency=250 requests=413559 errors=0
throughput=27552.9 req/s p50=8.6 ms p95=11.5 ms p99=15.6 ms
Fewer connections, no errors and 4.5 times the throughput. Instead of 250 processes competing for the same CPUs and the same shared buffers, 20 processes take turns doing the work; waiting moves to the cheap client side. But that cap works per process. If each of 12 pods opens 20 connections, it's 240 again.
PgBouncer: Gathering Connections in Front of the Server
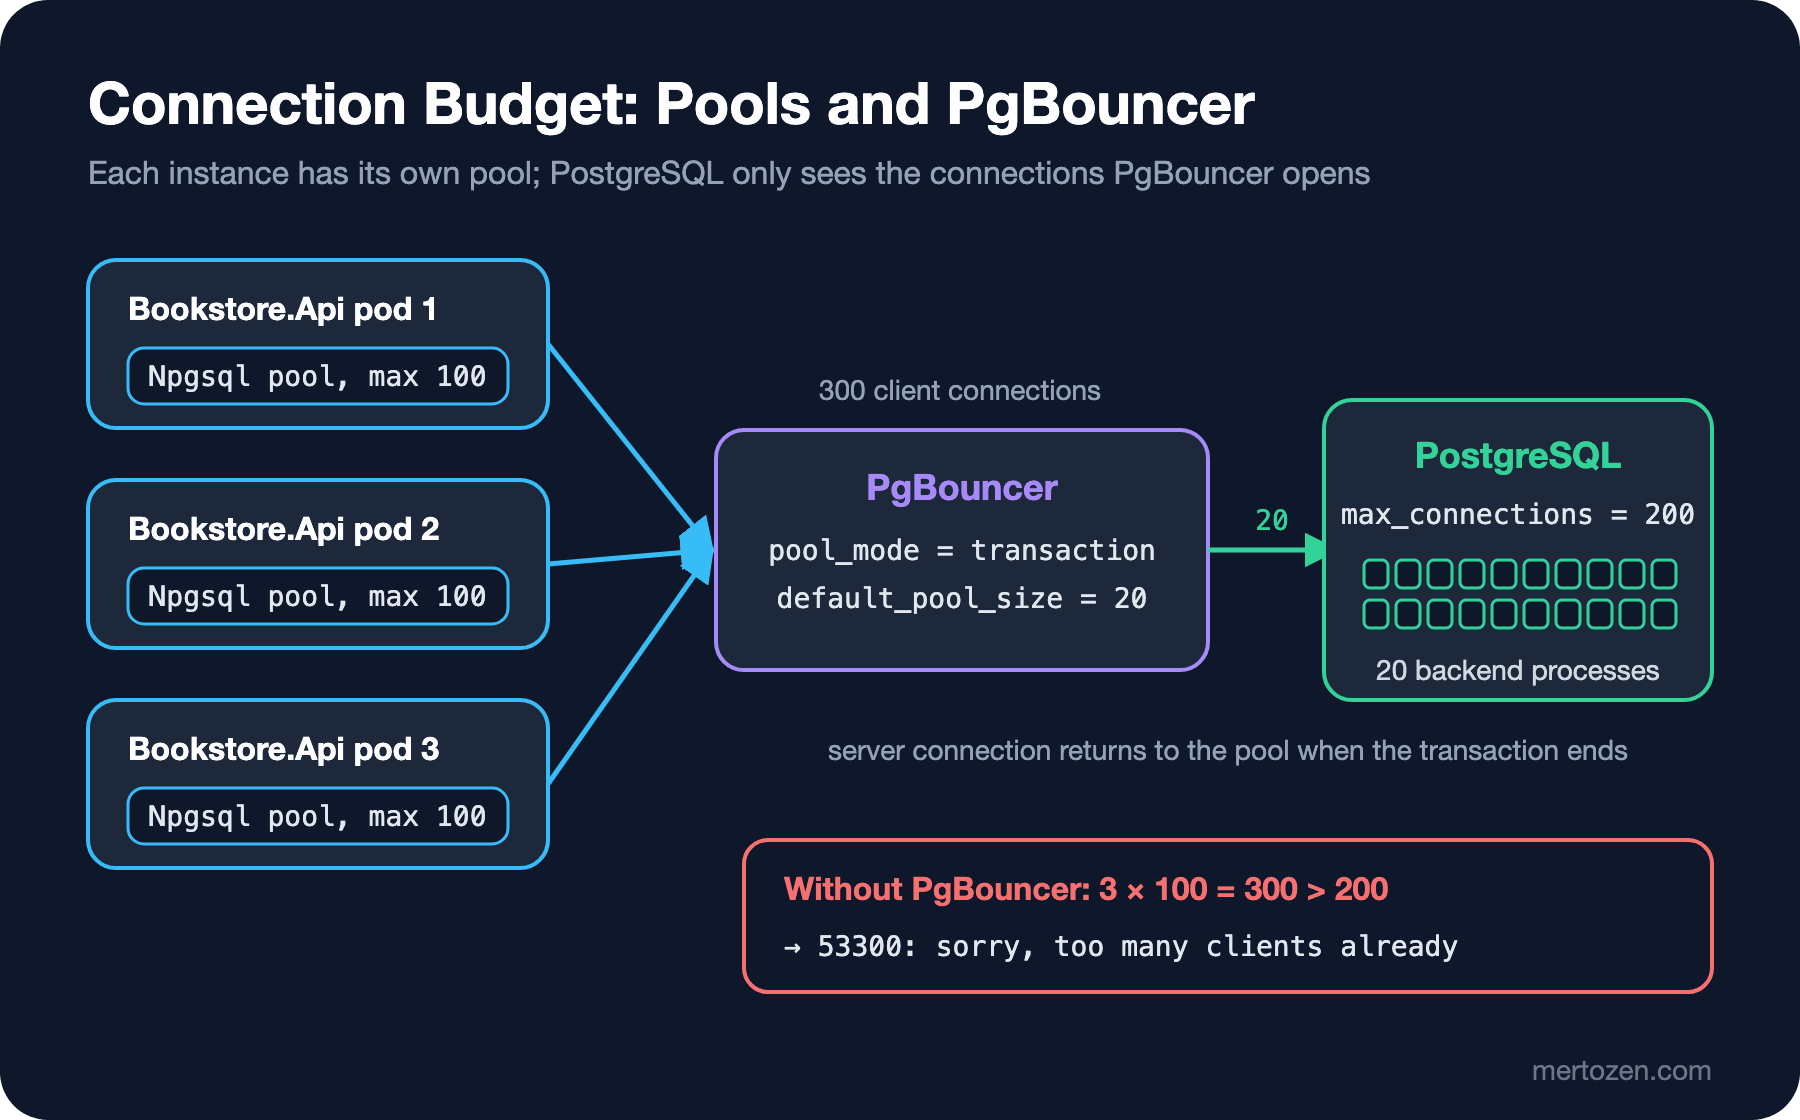
PgBouncer is a lightweight connection pooler that sits in front of PostgreSQL. Clients connect to PgBouncer, and PgBouncer opens a limited number of connections to the server and shares them among clients. When the sharing happens is decided by pool_mode:
| pool_mode | When the server connection is returned | Use |
|---|---|---|
session (default) | When the client disconnects | All session features work; limited gain |
transaction | When the transaction ends | The most common choice; no session state |
statement | After every query | Multi-statement transactions are not allowed |
The lab configuration:
[databases]
bookstore = host=pg1 port=5432 dbname=bookstore

[pgbouncer]
listen_addr = 0.0.0.0
listen_port = 6432
auth_type = scram-sha-256
auth_file = /etc/pgbouncer/userlist.txt
admin_users = postgres
pool_mode = transaction
default_pool_size = 20
max_client_conn = 2000
max_prepared_statements = 200
We point the same 250 clients, with the Npgsql pool still at 300, to PgBouncer's port 6432 this time. While the load runs, SHOW POOLS on PgBouncer's admin console (some of the columns):
 database  |   user    | cl_active | cl_waiting | sv_active | sv_idle |  pool_mode
-----------+-----------+-----------+------------+-----------+---------+-------------
 bookstore | postgres  |        66 |        184 |        20 |       0 | transaction
db=pgb concurrency=250 requests=502027 errors=0
throughput=33450.3 req/s p50=7.2 ms p95=12.0 ms p99=13.8 ms250 client connections (cl_active + cl_waiting), 20 connections on the server (sv_active). No errors, and 5.5 times the throughput of the direct connection. The limit here isn't one application's pool setting but a single point in front of the server; even if the pod count grows from 3 to 12, PostgreSQL keeps seeing 20 connections. The price: one more network hop, one more component to run and monitor, and at least two instances so that PgBouncer itself isn't a single point of failure. Managed services (such as the built-in PgBouncer of Azure Database for PostgreSQL) take over the operational part; we state this from the documentation and didn't try it in the lab.
The Traps of Transaction Mode: Session State
With transaction pooling there's no guarantee that two consecutive transactions run on the same server connection; on the contrary, transactions of different clients share the same server connection. Anything tied to the session is therefore lost or, worse, leaks to another client. To see the leak we add a separate database entry that shrinks the pool to one connection (bookstore_one = host=pg1 port=5432 dbname=bookstore pool_size=1). The first client sets a timeout for its own work and leaves:
SET statement_timeout = '50ms';
SELECT pg_backend_pid();
pg_backend_pid
----------------
34701Then a completely different client connects and runs the report query:
SELECT pg_backend_pid();
SHOW statement_timeout;
SELECT count(*) FROM order_items;
pg_backend_pid
----------------
34701
statement_timeout
-------------------
50ms
ERROR: canceling statement due to statement timeoutThe same backend process, the same setting, someone else's query canceled. In transaction mode server_reset_query (DISCARD ALL) doesn't run; the documentation states clearly that clients must not rely on session features in this mode. What doesn't work in this mode: SET/RESET, LISTEN, WITH HOLD cursors, SQL-level PREPARE, session-level advisory locks, temp tables other than ON COMMIT DROP, and LOAD. If you need a setting, use SET LOCAL inside the transaction or make it the role's or database's default. Since 1.26 PgBouncer tracks some parameters per client (application_name, TimeZone, search_path with PostgreSQL 18…); but statement_timeout isn't on that list and, as we saw, leaks. Extra parameters can be added with track_extra_parameters. Distributed locks built on advisory locks (the Background Jobs series post "Jobs Across Multiple Instances") and Npgsql's LISTEN/NOTIFY should bypass PgBouncer and connect to the server directly.
Prepared Statements, Npgsql and PgBouncer
For a long time protocol-level prepared statements didn't work with transaction pooling: the client prepared a statement on one server connection and tried to execute it on another in the next transaction. PgBouncer 1.21 solved this: when max_prepared_statements is above zero, PgBouncer tracks the client's statements and prepares them again on the server connection when needed. Since 1.24 the default is 200. We turn on Npgsql's auto-prepare (Max Auto Prepare=20;Auto Prepare Min Usages=2) and try with 100 clients:
db=pgb concurrency=100 requests=321431 errors=0
throughput=32130.3 req/s p50=2.9 ms p95=5.2 ms p99=6.3 ms
Repeating the same test with max_prepared_statements = 0, the old behavior:
db=pgb concurrency=100 requests=151663 errors=98926
throughput=15162.6 req/s p50=3.6 ms p95=6.3 ms p99=8.1 ms
first error: PostgresException: 26000: prepared statement "_auto0" does not exist
Two thirds of the requests failed. If you run an old PgBouncer version or an old configuration that sets this to zero, keep auto-prepare off. There's one more setting on the Npgsql side: Npgsql resets a connection returned to its pool with DISCARD ALL on next use (we saw it 10,435 times in the pg_stat_statements output in post 01). The Npgsql documentation says that if its own pool is on and PgBouncer is in transaction or statement mode, you need No Reset On Close=true. That way no extra command is sent on every connection use. The PgBouncer connection string in the lab:
Host=pgbouncer;Port=6432;Database=bookstore;Username=bookstore_api;Password=<secret>;No Reset On Close=true;Max Auto Prepare=20;Auto Prepare Min Usages=2Production Notes
Write the budget down. For each database keep a table of "who, how many instances, how many connections per pool" and calculate it with the HPA's maximum pod count. The total must stay below the resources on SQL Server, and below max_connections minus superuser_reserved_connections (3 in the lab) on PostgreSQL; leave room for maintenance too.
Turn pool metrics into alerts. hard-connects and number-of-reclaimed-connections in SqlClient, the pool usage metrics in Npgsql, cl_waiting and maxwait in PgBouncer's SHOW POOLS. cl_waiting staying above zero means the server-side pool is too narrow or queries are slow.
Think of timeouts in layers. Connect Timeout also covers waiting for a connection from the pool; it should be shorter than the HTTP request's own timeout so you can return a meaningful error to the user. In PgBouncer, query_wait_timeout limits how long a client waits for a server connection.
Account for failovers and deployments. While a new version rolls out, old and new pods run side by side for a while and the connection count peaks. After a failover, all pools try to reconnect at the same time (05).
Common Pitfalls
Hiding a leak by raising Max Pool Size or Connect Timeout: the error becomes rarer but doesn't go away; the leak still consumes connections, and more sleeping sessions pile up on the server.
Generating a different connection string per tenant or per request: putting a request id in Application Name, or creating a new SqlCredential or token callback each time, fragments the pool. Build the connection string once with SqlConnectionStringBuilder and reuse it.
Relying on session state with transaction pooling: SET, advisory locks, LISTEN and temp tables leak to other clients or get lost. Route workloads that need these features to a separate session-mode pool or straight to the server.
Mistaking DbContext pooling for connection pooling: turning on AddDbContextPool doesn't change the connection count; you still need Max Pool Size and the budget calculation.
Keeping Min Pool Size high: every instance opens that many connections at startup and keeps them while idle. When all new pods do this at once during scale-out, it creates a login storm on the server.
A Small Experiment
★☆☆ Change the leak example to a query that includes BEGIN TRANSACTION and leave it uncommitted. Watch how open_transaction_count changes in sys.dm_exec_sessions and what happens when another session tries to update the same rows.
★★☆ Watch the fragmentation example from outside with dotnet-counters monitor and compare the ratio of hard-connects to soft-connects in both scenarios.
★★★ Add a second application process in front of PgBouncer and repeat the 250-client load with default_pool_size at 10, 20 and 40. Find the value with the highest throughput and explain it with PostgreSQL's wait event distribution.
In the next post we measure the effect of one giant DELETE on the transaction log, lock escalation and a replica, then move Bookstore's four-year-old orders to an archive in batches without stopping the live system; online index builds and online schema changes are in the same post.