

Scaling Out and Running SignalR in Production: Sticky Sessions, Redis Backplane, Azure SignalR Service and Monitoring
SignalR on multiple servers needs two things: sticky sessions that keep negotiate and the connection on the same server, and a backplane that carries messages between servers. Real error messages with Nginx, the skipNegotiation exception, the Redis backplane and its channel prefix, messages lost during a Redis outage, Azure SignalR Service, and SignalR metrics and tracing.
Version note: The code in this post was built and run with .NET 10, Microsoft.AspNetCore.SignalR.StackExchangeRedis 10.0.14, Redis 8.2 and Nginx 1.29; the Azure SignalR Service sample was only compiled, with Microsoft.Azure.SignalR 1.33.1.
Guess First
Bookstore's SignalR application runs fine on a single server. Traffic grew, so you put an Nginx in front and started a second copy of the same application. You changed no code. Two questions: are users' connections affected? When one of the connected users sends an announcement, do users connected to the other server see it?
The answer to both is "no, not always", and the reasons differ. In this post we reproduce and fix these problems one by one with two application copies, an Nginx and a Redis container, and then look at how to monitor SignalR in production.
The Second Server: Where Did Half the Messages Go?
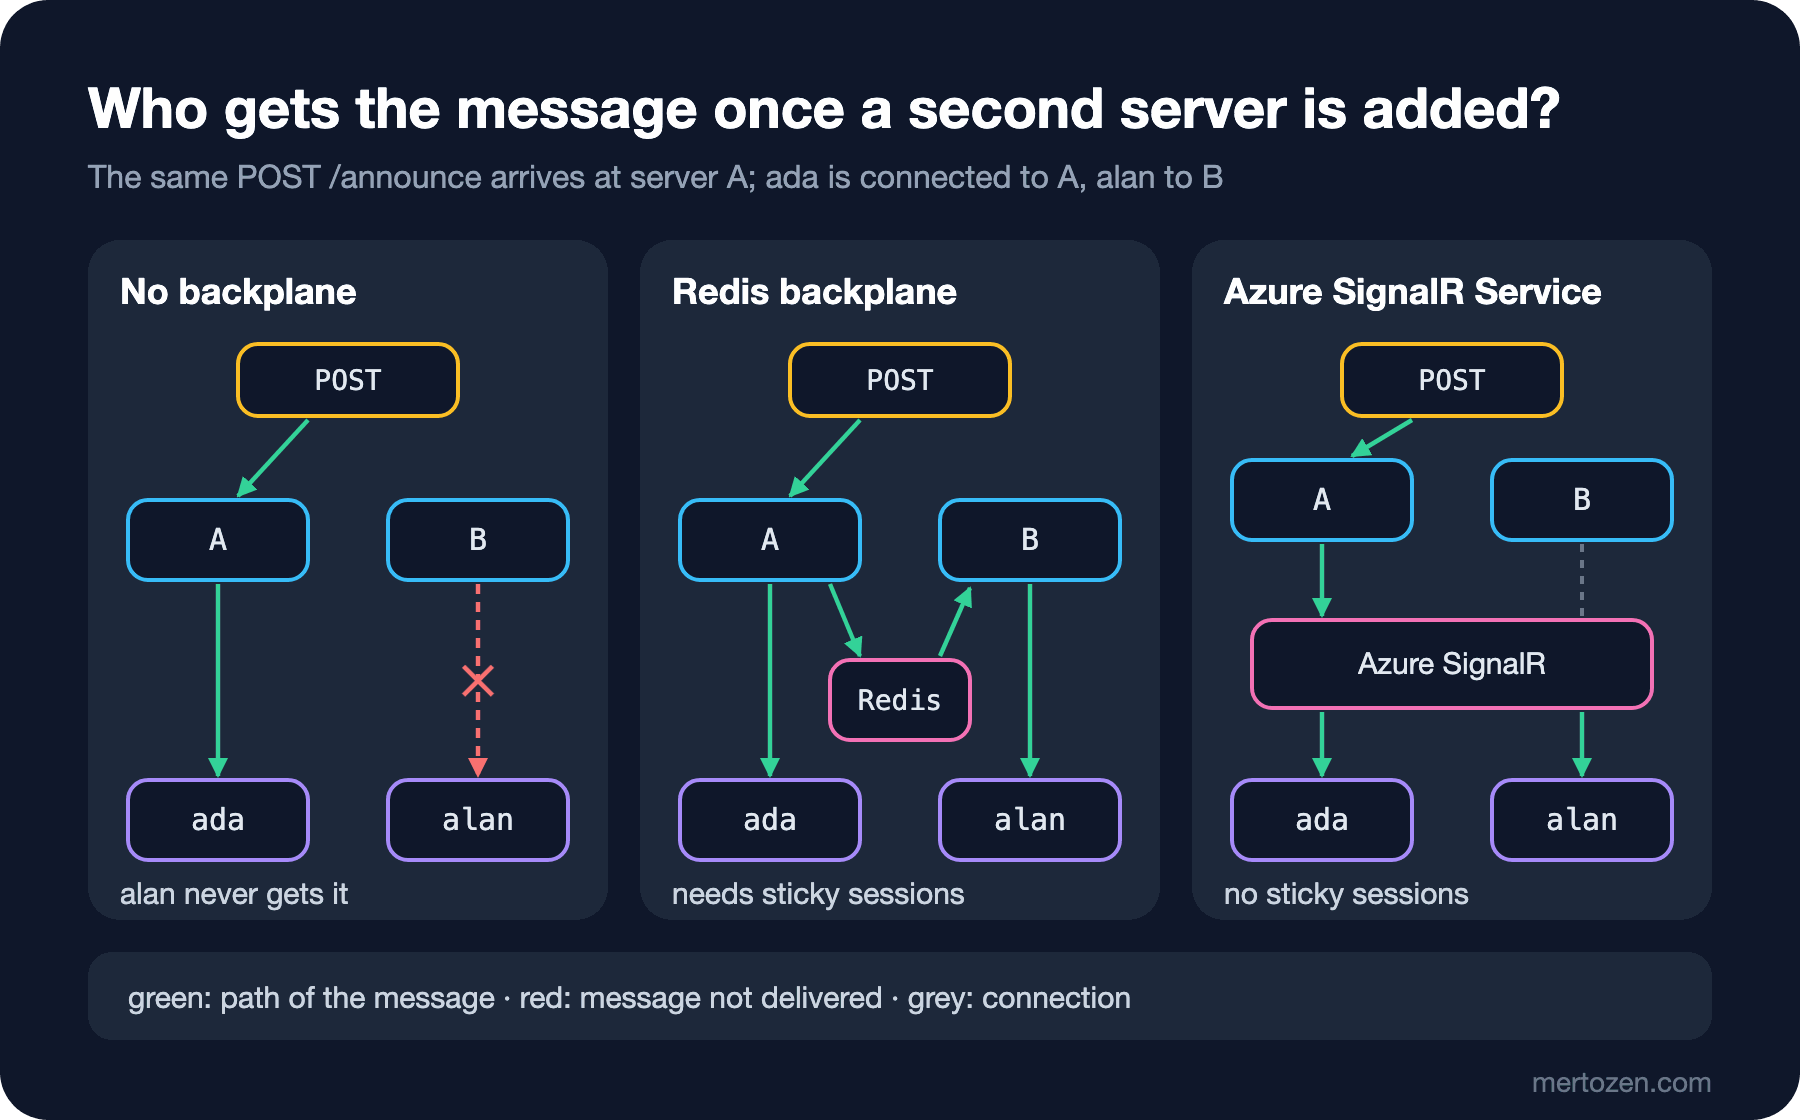
The setup: copies A (17681) and B (17682) of the same application. Ada is connected to A, Alan to B. An announcement is POSTed to A:
app.MapHub<AnnouncementHub>("/hubs/announcements");

app.MapPost("/announce", async (string text, IHubContext<AnnouncementHub> hub) =>
{
    await hub.Clients.All.SendAsync("Announcement", text, instance);
    return TypedResults.Ok(new { sentBy = instance });
});
ada (on A) <- "Store closes at 18:00" (sent by A)
POST /announce to A "Store closes at 18:00": 200 {"sentBy":"A"}Alan received nothing, and there is no error anywhere. The reason is simple: Clients.All means "every connection in this process". Each server keeps its own connection list in memory and knows nothing about the other. The connection registry we wrote in the second post of the series and Clients.User from the fifth post had the same limit. Because the load balancer spreads users across servers at random, in production this shows up as "notifications sometimes arrive"; it depends on which server each user lands on.
Sticky Sessions: Negotiate and the Connection on the Same Server
The first question is sneakier. I defined two locations in Nginx: a classic upstream that spreads requests across both servers, and a sticky upstream that sends the same client IP (Internet Protocol) address to the same server every time with ip_hash:
map $http_upgrade $connection_upgrade {
    default upgrade;
    ''      close;
}

upstream bookstore_rr {
    server host.docker.internal:17681;
    server host.docker.internal:17682;
}

upstream bookstore_sticky {
    ip_hash;
    server host.docker.internal:17681;
    server host.docker.internal:17682;
}

server {
    listen 80;

    # no sticky sessions: requests are spread across both servers
    location /rr/ {
        proxy_pass http://bookstore_rr/;
        proxy_http_version 1.1;
        proxy_set_header Upgrade $http_upgrade;
        proxy_set_header Connection $connection_upgrade;
        proxy_buffering off;
        proxy_read_timeout 100s;
    }

    # ip_hash: the same client IP always goes to the same server
    location /sticky/ {
        proxy_pass http://bookstore_sticky/;
        proxy_http_version 1.1;
        proxy_set_header Upgrade $http_upgrade;
        proxy_set_header Connection $connection_upgrade;
        proxy_buffering off;
        proxy_read_timeout 100s;
    }
}
The Upgrade and Connection headers are for WebSocket, proxy_buffering off is for SSE (Server-Sent Events), and proxy_read_timeout is there to be longer than long polling and the 15-second keep-alive; all of it matches Microsoft's Nginx recommendation. I connected 10 times through each location and asked the hub "which server are you on?":
/rr/ default: {
 "failed: Unable to connect to the server with any of the available transports. Error: WebSockets failed: Error: WebSock": 6,
 "ok on B": 2,
 "ok on A": 2
}
/rr/ lp: {
 "failed: Unable to connect to the server with any of the available transports. WebSockets failed: Error: 'WebSockets' i": 10
}
/rr/ skip: {
 "ok on B": 5,
 "ok on A": 5
}
/sticky/ default: {
 "ok on A": 10
}
Without sticky sessions, 6 out of 10 connections could not be established. The full error message states the reason itself:
Unable to connect to the server with any of the available transports. Error: WebSockets failed: Error: WebSocket failed to connect. The connection could not be found on the server, either the endpoint may not be a SignalR endpoint, the connection ID is not present on the server, or there is a proxy blocking WebSockets. If you have multiple servers check that sticky sessions are enabled. Error: ServerSentEvents failed: Error: EventSource failed to connect. The connection could not be found on the server, either the connection ID is not present on the server, or a proxy is refusing/buffering the connection. If you have multiple servers check that sticky sessions are enabled. Error: LongPolling failed: Error: No Connection with that ID: Status code '404'The negotiate request went to A, and A issued a connection token; the WebSocket request that followed landed on B, which had never heard of that token. The 4 successful connections are the cases where both requests happened to land on the same server. Long polling (lp) never worked, because every poll is a separate HTTP (Hypertext Transfer Protocol) request and all of them must reach the same server too.
The only way to run without sticky sessions is on the skip line: transport: HttpTransportType.WebSockets and skipNegotiation: true on the client. No negotiate request is sent at all; the connection is established as a single WebSocket request and stays on whichever server it lands on. The price is no SSE or long polling fallback; a user behind a proxy that blocks WebSockets cannot connect.
On /sticky/, all 10 connections went to A: every request came from the same IP (Docker's gateway). This also shows the weakness of ip_hash in production: a thousand users behind the same corporate NAT (Network Address Translation) pile onto a single server. Cookie-based sticky sessions (sticky cookie in Nginx Plus, ARR (Application Request Routing) affinity in Azure App Service, session affinity annotations on Kubernetes ingresses) spread the load more evenly.
The Redis Backplane
Sticky sessions solved establishing the connection; they did not solve the message reaching the other server. For that, the servers need to be able to tell each other "deliver this message to your connections too". The Redis backplane does this with Redis's pub/sub feature:
ISignalRServerBuilder signalR = builder.Services.AddSignalR();
if (args.Contains("--redis"))
{
    signalR.AddStackExchangeRedis("localhost:17679", options =>
        options.Configuration.ChannelPrefix = RedisChannel.Literal("bookstore"));
}
I restarted both copies with --redis and repeated the same test:
POST /announce to A "Store closes at 18:00": 200 {"sentBy":"A"}
  ada  (on A) <- "Store closes at 18:00" (sent by A)
  alan (on B) <- "Store closes at 18:00" (sent by A)
Not a single line of application code changed; Clients.All, Clients.User and Clients.Group now reach connections on every server. While the clients were connected, I looked at the channels in Redis:
$ redis-cli PUBSUB CHANNELS '*'
bookstoreBookstore.Realtime.AnnouncementHub:all
bookstoreBookstore.Realtime.AnnouncementHub:connection:7EQoJRwjog3T7L9Z1cQoEA
bookstoreBookstore.Realtime.AnnouncementHub:connection:hcYgsplz1qevkdtQawvsGg
bookstoreBookstore.Realtime.AnnouncementHub:internal:ack:Mac_03ac3ce396614dbc981319514892d7ac
bookstoreBookstore.Realtime.AnnouncementHub:internal:ack:Mac_0a1cbd74ba37477db52d96f893c6a8e2
bookstoreBookstore.Realtime.AnnouncementHub:internal:groups
bookstoreBookstore.Realtime.AnnouncementHub:internal:return:Mac_03ac3ce396614dbc981319514892d7ac
bookstoreBookstore.Realtime.AnnouncementHub:internal:return:Mac_0a1cbd74ba37477db52d96f893c6a8e2
bookstore__Booksleeve_MasterChanged
There is an all channel per hub, a channel per connection (user and group channels also open as long as there are connections or memberships), and internal channels per server. This also shows why ChannelPrefix matters: if two applications sharing the same Redis do not use different prefixes, one application's Clients.All reaches the other's users too. Note that the prefix is added to the channel name without a separator; add a : at the end yourself if you want it readable.
The point not to forget: the backplane does not remove the need for sticky sessions. Negotiate and the connection must still go to the same server; the backplane only carries messages between servers. Also, every message goes to every server: with 10 servers, even a message whose only recipient is on one of them reaches all 10 through Redis. Microsoft recommends running Redis in the same data center as the application; every millisecond in between is added to every message.
What Happens When Redis Goes Down?
While announcements were being sent, I stopped my own Redis container for 6 seconds:
redis stopped at 05:51:54
redis started at 05:52:00
  ada  (on A) <- "before outage" (sent by A)
  alan (on B) <- "before outage" (sent by A)
POST /announce to A "before outage": 200 {"sentBy":"A"}
  ada  (on A) <- "during outage" (sent by A)
POST /announce to A "during outage": 200 {"sentBy":"A"}
  ada  (on A) <- "after recovery" (sent by A)
POST /announce to A "after recovery": 200 {"sentBy":"A"}
  alan (on B) <- "after recovery" (sent by A)
fail: Microsoft.AspNetCore.SignalR.StackExchangeRedis.RedisHubLifetimeManager[9]
Connection to Redis failed.
StackExchange.Redis.RedisConnectionException: SocketClosed (ReadEndOfStream, last-recv: 0) on localhost:17679/Subscription, ...The announcement sent during the outage never reached Alan, not even later. In my test the POST still returned 200 and Ada, on the same server, received the message; so the loss did not surface as an error on the sending side. Microsoft's documentation is clear too: SignalR does not buffer messages sent while Redis is down, they are lost; when Redis comes back, SignalR reconnects by itself (the last announcement reached both sides). During the outage the users' connections stayed open; only the messages between servers were lost.
The conclusion: in a system with a Redis backplane, Redis is a critical dependency. Either run Redis highly available (Sentinel or Redis Cluster; the backplane works on a cluster without code changes), or design the messages that must not be missed to be recoverable from a durable source (a database, a sequence-numbered event log), as we discussed in the earlier posts.
Azure SignalR Service
// the connection string is read from the "Azure:SignalR:ConnectionString" configuration key
builder.Services.AddSignalR()
    .AddAzureSignalR();
Azure SignalR Service cannot be run locally, and I did not create an Azure resource for this post; I only compiled this code with the Microsoft.Azure.SignalR 1.33.1 package and did not run it. According to the documentation, the mechanism works like this: the client comes to the application's negotiate endpoint, but the response redirects it to the service's address with an access token. The client's persistent connection is opened to the service, not to the application server. The application servers keep a small, fixed number of connections to the service; hub method calls and Clients.* messages flow over those.
The consequences matter. No sticky sessions are needed, because the client is connected to the service anyway. Since the application server does not carry thousands of persistent connections, you scale it by workload rather than by connection count. The service also acts as the backplane. Microsoft recommends it over the Redis backplane for SignalR applications hosted on Azure. In return there is a cloud dependency, per-unit pricing, and network latency between the service and the application; for systems running in their own data center that want low latency, the Redis backplane fits better. Besides Redis there are community backplanes (SQL Server, Orleans, NCache, Rebus), but none of them is Microsoft's own package.
Monitoring: Metrics and Tracing
Since .NET 8, ASP.NET Core publishes built-in metrics for SignalR and Kestrel; since .NET 9 there is also an ActivitySource for hub methods. In production you send these to Prometheus or an APM (Application Performance Monitoring) tool with OpenTelemetry; here I read them in-process with a MeterListener to see what is published:
// to read SignalR and Kestrel metrics in-process (in reality OpenTelemetry/Prometheus)
public sealed class ConnectionMetrics : IDisposable
{
    private readonly MeterListener _listener = new();
    private readonly ConcurrentDictionary<string, double> _values = new();

    public ConnectionMetrics()
    {
        _listener.InstrumentPublished = (instrument, listener) =>
        {
            if (instrument.Meter.Name is "Microsoft.AspNetCore.Http.Connections" or "Microsoft.AspNetCore.Server.Kestrel")
            {
                listener.EnableMeasurementEvents(instrument);
            }
        };
        _listener.SetMeasurementEventCallback<long>((instrument, value, tags, _) => Record(instrument, value, tags));
        _listener.SetMeasurementEventCallback<double>((instrument, value, tags, _) => Record(instrument, value, tags));
        _listener.Start();
    }

    private void Record(Instrument instrument, double value, ReadOnlySpan<KeyValuePair<string, object?>> tags)
    {
        string? transport = null;
        foreach (KeyValuePair<string, object?> tag in tags)
        {
            if (tag.Key == "signalr.transport")
            {
                transport = tag.Value?.ToString();
            }
        }
        string key = transport is null ? instrument.Name : $"{instrument.Name}{{transport={transport}}}";
        // keep the measurement count for histograms and the sum for counters
        double delta = instrument is Histogram<double> ? 1 : value;
        _values.AddOrUpdate(instrument is Histogram<double> ? key + ".count" : key, delta, (_, current) => current + delta);
    }

    public SortedDictionary<string, double> Snapshot() => new(_values);

    public void Dispose() => _listener.Dispose();
}
The snapshot I took after opening two WebSocket connections and one SSE connection to A, before closing one of them:
{
  "kestrel.active_connections": 5,
  "kestrel.connection.duration.count": 7,
  "kestrel.queued_connections": 0,
  "kestrel.upgraded_connections": 2,
  "signalr.server.active_connections{transport=server_sent_events}": 1,
  "signalr.server.active_connections{transport=web_sockets}": 2,
  "signalr.server.connection.duration{transport=web_sockets}.count": 3
}
These are what to watch: signalr.server.active_connections, the open SignalR connections per transport (a growing share of SSE and long polling is a sign of a proxy blocking WebSockets); signalr.server.connection.duration, the lifetime of connections (shrinking means drops are increasing); kestrel.upgraded_connections, TCP (Transmission Control Protocol) connections upgraded to WebSocket; and kestrel.active_connections, all connections. It is normal for the Kestrel count to be higher than the SignalR count; short-lived HTTP connections such as negotiate and the POSTs alongside SSE are counted too.
On the tracing side, an ActivityListener listening to the Microsoft.AspNetCore.SignalR.Server source wrote this span for every hub call:
[trace] Bookstore.Realtime.AnnouncementHub/WhereAmI 0,0 ms rpc.method=WhereAmI rpc.system=signalr rpc.service=Bookstore.Realtime.AnnouncementHubIn OpenTelemetry you turn this on with tracing.AddSource("Microsoft.AspNetCore.SignalR.Server"). The documentation specifically notes that hub method spans have no parent, i.e. they are not grouped under the long-lived connection. In the .NET client, the Microsoft.AspNetCore.SignalR.Client source produces client spans and carries the context to the server; the JavaScript client has no tracing yet. If you want to watch the metrics from a terminal for a while, dotnet-counters monitor --counters Microsoft.AspNetCore.Http.Connections shows the same data.
Production Notes
Load test with connection counts, not request counts. SignalR's bottleneck is usually not requests per second but concurrent open connections and messages per second. In the first post of the series we measured that 2,000 idle SignalR connections added about 62 MB of memory; for your target connection count, test memory, the file descriptor limit (ulimit -n), the load balancer's connection limit and Redis pub/sub traffic together. We will cover the tools for this in the upcoming Performance and Load Testing series.
Plan your deploys. When a server is shut down, all clients connected to it reconnect and sticky sessions spread them over the remaining servers; a rolling deploy has a reconnect wave at every step. The retry policy with jitter from the previous post pays off here.
Keep load balancer and proxy timeouts in line with SignalR's keep-alive: by default the server sends a keep-alive every 15 seconds, and the client considers the connection dead after 30 seconds without a message. If any idle timeout in between is shorter than these, connections drop at regular intervals.
Common Pitfalls
Thinking the backplane replaces sticky sessions. The backplane carries messages; it does not make negotiate and the connection go to the same server.
Going to production without sticky sessions because it "mostly works". Some connections fail at random, and the error is only visible on the client.
Using the same Redis for several applications without a ChannelPrefix. One application's broadcasts reach the other's users.
Assuming a Redis outage will surface as an error on the sending side. In my test the POST returned 200 and the user on the other server lost the message.
Thinking ip_hash is the only sticky solution. Users behind NAT pile onto one server; cookie-based affinity is more balanced.
Monitoring metrics only through HTTP request counts. In SignalR the real signals are open connection counts, transport distribution and connection lifetime.
A Small Experiment
★☆☆ Run both copies without Redis and connect two clients through /sticky/. Explain why announcements reach both of them because they landed on the same server; then connect one of the clients directly to the other copy's port.
★★☆ Move the values in ConnectionMetrics to a Prometheus endpoint with OpenTelemetry (AddMeter("Microsoft.AspNetCore.Http.Connections")) and watch the signalr.server.active_connections chart while opening and closing 200 connections.
★★★ Write a ConnectionMultiplexer.ConnectionFailed handler that turns a health check (/health) to "Degraded" when the Redis connection drops, and discuss what the load balancer should do in that case: stop traffic, or just raise an alert?
In the last post of the series we return to version news: what came to real-time from .NET 8 to .NET 11; stateful reconnect, Native AOT (Ahead-of-Time), SSE, and SignalR authentication refresh, which renews the token without dropping the connection.