

Processes and Signals: ps, top/htop, kill, nice, the Process Tree and Zombies
If you stop a .NET application on Linux with SIGTERM or SIGINT, it finishes in-flight requests and exits cleanly; SIGHUP and SIGKILL kill it at once (shown with a real experiment). We cover reading ps and top output (VIRT/RES, STAT, load average), the process tree, which jobs die when SSH drops with jobs/fg/bg, the difference between nohup, disown and setsid, SigIgn, nice/renice, open files with /proc and lsof, and why zombies do not die with kill.
Version note: The commands in this post were run on a test VM with Ubuntu Server 24.04.5 LTS (kernel 6.8, procps 4.0, bash 5.2); the code was built with .NET SDK 10.0.402 and run on the ASP.NET Core 10.0.15 runtime.
Guess First
Anyone who has worked with Nginx knows kill -HUP as "reload the configuration"; Nginx really does that. On the server, the API of Bookstore, the online bookstore used as the shared example across this site's series, is running and is in the middle of a report request that takes 5 seconds. Out of habit, someone sends the same signal to the .NET process:
$ sudo kill -HUP 4250What happens: does .NET reload its configuration, ignore the signal, or does the process exit? If it exits, does the report request in progress complete? The answer is in the middle of the post, where we run the same experiment with four different signals.
In the third post we ran Bookstore as its own service user. In this post we look at that process from the outside, read the output of ps and top, shut down a .NET application cleanly with signals, see why processes die when SSH drops, and cover priority and zombies. The operating system theory behind processes (address spaces, scheduling) is in the Operating System Fundamentals series; here we focus on the work we do on the server from the command line.
A Slow Endpoint for the Experiment
To be able to see shutdown behavior, I added a report endpoint that waits for the requested time, plus lifecycle logs, to Bookstore.Api:
// Slow report: lets us watch what happens to an in-flight request during shutdown
app.MapGet("/api/reports/sales", async (int seconds) =>
{
    await Task.Delay(TimeSpan.FromSeconds(seconds));
    return Results.Ok(new { report = "sales", seconds });
});

app.Lifetime.ApplicationStarted.Register(() =>
    app.Logger.LogInformation("Bookstore.Api started, PID {Pid}", Environment.ProcessId));
app.Lifetime.ApplicationStopping.Register(() =>
    app.Logger.LogInformation("Stopping: draining in-flight requests"));
app.Lifetime.ApplicationStopped.Register(() =>
    app.Logger.LogInformation("Stopped cleanly"));
I put the new release into /opt/bookstore/releases/2026-11-14-3 as the deploy user, switched current and started the application with sudo -u bookstore. Lifecycle events and IHostApplicationLifetime were covered in the ASP.NET Core Web API series; here we use them only as log lines.
Processes, PIDs and PPIDs: Looking with ps
Every process has a PID and a PPID, the PID of the process that started it. The fastest way to find a process is pgrep; for details, use ps:
$ pgrep -a dotnet
1578 dotnet Bookstore.Api.dll --urls http://127.0.0.1:5000
$ ps -o pid,ppid,user,stat,etime,cmd -C dotnet
    PID    PPID USER     STAT     ELAPSED CMD
   1578    1575 booksto+ Sl         00:06 dotnet Bookstore.Api.dll --urls http://127.0.0.1:5000
$ ps aux | head -1; ps aux | grep -E "[d]otnet|[s]shd:"
USER         PID %CPU %MEM    VSZ   RSS TTY      STAT START   TIME COMMAND
root         767  0.3  0.8  12028  8204 ?        Ss   14:48   0:00 sshd: /usr/sbin/sshd -D [listener] 0 of 10-100 startups
root        1526  4.4  1.0  14744 10428 ?        Ss   14:50   0:00 sshd: ada [priv]
ada         1573  1.0  0.7  15000  7096 ?        S    14:50   0:00 sshd: ada@notty
root        1575  1.8  0.7  17308  7100 ?        S    14:50   0:00 sudo -u bookstore nohup dotnet Bookstore.Api.dll --urls http://127.0.0.1:5000
booksto+    1578 85.1  7.1 273908036 70636 ?     Sl   14:50   0:06 dotnet Bookstore.Api.dll --urls http://127.0.0.1:5000
With ps -o you pick the columns you want; -C dotnet filters by command name. ps aux shows all processes of all users with the classic Unix columns; writing [d]otnet in the grep pattern is an old habit that keeps grep's own line out of the result. The STAT column is the one you will use most: R running or runnable, S sleeping while waiting for something (network, timer), D uninterruptible sleep (usually disk or network file system I/O), Z zombie, T stopped. Extra letters: s session leader, l multi-threaded, N low priority, + the foreground process group of the terminal.
To see which process is whose child, use the tree view:
$ ps -ef --forest | grep -E -A1 "[s]shd|[s]udo -u bookstore" | head -20
root         767       1  0 14:48 ?        00:00:00 sshd: /usr/sbin/sshd -D [listener] 0 of 10-100 startups
root        1526     767  4 14:50 ?        00:00:00  \_ sshd: ada [priv]
ada         1573    1526  1 14:50 ?        00:00:00      \_ sshd: ada@notty
ada         1574    1573  2 14:50 ?        00:00:00          \_ bash /tmp/04a.sh
root        1575    1574  1 14:50 ?        00:00:00              \_ sudo -u bookstore nohup dotnet Bookstore.Api.dll --urls http://127.0.0.1:5000
booksto+    1578    1575 85 14:50 ?        00:00:00              |   \_ dotnet Bookstore.Api.dll --urls http://127.0.0.1:5000
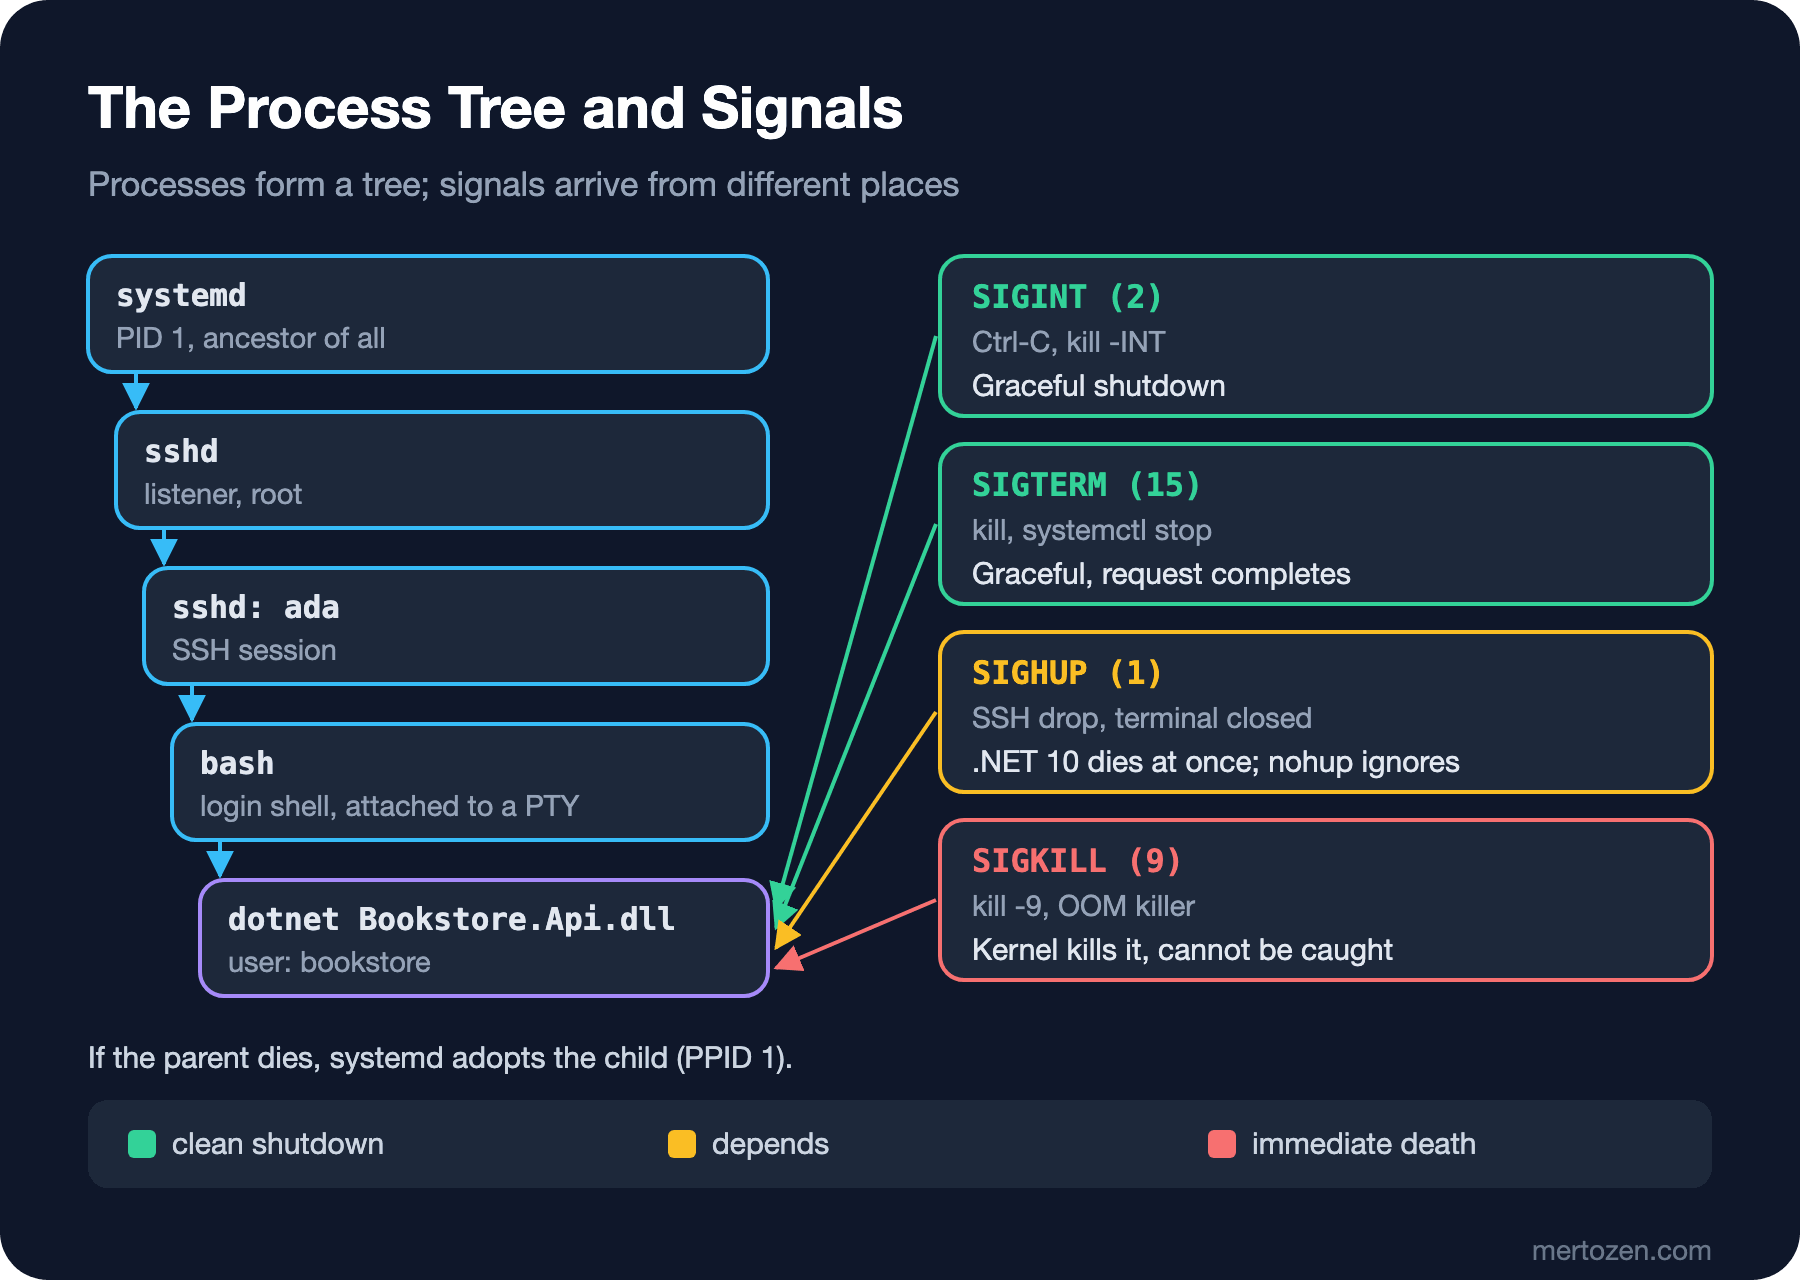
The chain: the SSH listener started by systemd, my SSH session, the bash in that session, the sudo it started, and at the bottom dotnet running as the bookstore user. The application is a grandchild of my SSH session; that is why what happens when the session closes matters.
top and htop: Reading the Columns
$ top -b -n 1 -o %MEM | head -12
top - 14:50:23 up 3 min,  1 user,  load average: 0.88, 0.84, 0.36
Tasks: 123 total,   1 running, 122 sleeping,   0 stopped,   0 zombie
%Cpu(s): 43.5 us, 17.4 sy,  0.0 ni, 39.1 id,  0.0 wa,  0.0 hi,  0.0 si,  0.0 st
MiB Mem :    960.1 total,    490.4 free,    292.2 used,    330.3 buff/cache
MiB Swap:      0.0 total,      0.0 free,      0.0 used.    668.0 avail Mem

    PID USER      PR  NI    VIRT    RES    SHR S  %CPU  %MEM     TIME+ COMMAND
   1578 booksto+  20   0  261.2g  71160  61376 S  81.2   7.2   0:06.91 dotnet
    364 root      rt   0  288960  27300   8768 S   0.0   2.8   0:00.93 multipa+
    732 root      20   0  110016  23116  13660 S   0.0   2.4   0:01.28 unatten+
    309 root      19  -1   66836  17724  16544 S   0.0   1.8   0:05.98 systemd+
    682 root      20   0  468936  13588  11436 S   0.0   1.4   0:01.56 udisksd
-b -n 1 runs top once and prints the output as text; interactively, M sorts by memory, P by CPU, 1 shows cores separately, q quits. htop shows the same information in color and lets you navigate with the mouse; on Ubuntu, sudo apt install htop.
The scary column is VIRT: the .NET process appears to use 261 GB of virtual memory on a VM with 1 GB of memory. VIRT is the address space the process has reserved; the .NET runtime and the GC reserve large address ranges at startup but do not back them with physical memory. The physical memory actually in use is RES: 71 MB. SHR is the part of it that can be shared with other processes (shared libraries, .dll files mapped into memory). Think of memory alerts and container limits in terms of RES, not VIRT; how virtual memory and pages work is in the virtual memory post of the Operating System Fundamentals series.
%CPU is measured per core: on a two-core machine one process can show up to 200%. The 81 here comes from the application having started a few seconds earlier; at startup the CPU is briefly high while the runtime compiles code. wa on the top line is the time the CPU sat idle waiting for disk I/O; in slowness incidents, if this number is high the problem is the disk, not the CPU.
The load average is the average number of processes that are running or waiting to run (R) plus those in uninterruptible sleep (D), over the last 1, 5 and 15 minutes. On its own it means nothing; you read it against the number of cores: on this machine, where nproc says 2, 0.88 is relaxed, 2 is full, and 4 means a job is waiting in line at every moment. Because Linux also counts processes in D state, a high load average while the CPU looks idle usually means a disk or an NFS connection is stuck. In the tenth post we dig into this with vmstat and iostat.
Signals: TERM, INT, HUP and KILL
A signal is a small notification the kernel delivers to a process. A process can catch most signals and act as it likes; if it does not, the default action applies, which for most signals is to die. Two can never be caught: SIGKILL (kill) and SIGSTOP (stop). The name of the kill command is misleading; it actually sends signals, and its default signal is SIGTERM.
For the answer to the guess I ran the same experiment with four signals: start the application, send the 5-second report request, send the signal a second later, and see what happens to the request and the process:
=== SIGTERM
$ sudo kill -TERM 4299
in-flight request: 200 after 5.474425s
process exited after 4.980515389s
=== SIGINT
$ sudo kill -INT 4157
in-flight request: 200 after 5.481157s
process exited after 4.919335640s
=== SIGHUP
$ sudo kill -HUP 4250
in-flight request: 000 after 1.350014s
curl exit=52
process exited after .747422686s
=== SIGKILL
$ sudo kill -KILL 1825
in-flight request: 000 after 1.266063s
curl exit=52
process exited after .459700473s
With SIGTERM and SIGINT the application's log looked like this:
info: Microsoft.Hosting.Lifetime[0]
      Application is shutting down...
info: Bookstore.Api[0]
      Stopping: draining in-flight requests
info: Bookstore.Api[0]
      Stopped cleanly
The .NET host catches SIGTERM, SIGINT and SIGQUIT and starts a graceful shutdown: Kestrel stops accepting new connections, waits by default 30 seconds for in-flight requests to finish, then the process exits. The report request completed with 200, and the process waited for it and exited after about 5 seconds. With SIGHUP, however, .NET 10 caught nothing: the default action applied, the process died within half a second, the request was cut off (curl exit 52, empty reply from the server) and not a single line was written to the log. So the answer to the guess: the signal that means "reload" for Nginx shuts a .NET application down. With SIGKILL the result is the same but the reason is different: the kernel stops the process without asking it anything, so there is no chance to write logs, close connections or flush files.
That is why the order is always the same: first kill PID (TERM), wait for the application's shutdown time, and only if it is still alive, kill -9. systemd does the same on systemctl stop: SIGTERM first, SIGKILL when TimeoutStopSec runs out. We saw this together with the KillSignal setting in the systemd post of the Web Servers and Hosting series.
To select processes by name and send them a signal there is pkill; it uses the same matching as pgrep. Before using it, try the same pattern with pgrep -a, because -f searches the whole command line and can catch more than you think (there is an example in the pitfalls below).
Foreground, Background and a Dropped SSH Connection
In the shell a command normally runs in the foreground: the prompt does not return until it finishes, and Ctrl-C sends it SIGINT. Put & at the end and it goes to the background. In an interactive SSH session:
$ sleep 300 &
[1] 4441
$ jobs -l
[1]+  4441 Running                 sleep 300 &
$ sleep 200
^Z
[2]+  Stopped                 sleep 200
$ jobs
[1]-  Running                 sleep 300 &
[2]+  Stopped                 sleep 200
$ bg %2
[2]+ sleep 200 &
$ fg %1
sleep 300
^C
$ disown %2
$ jobs
$
Ctrl-Z stops the foreground job (SIGTSTP), bg continues a stopped job in the background, fg brings a job back to the front. disown removes a job from the shell's job list; the process keeps running but is no longer this shell's job. You see why that matters when the SSH connection drops. In one session I started sleep in four different ways and simulated a network drop by killing the ssh process on the client side with kill -9:
$ sleep 601 &
$ nohup sleep 602 > /dev/null 2>&1 &
$ sleep 603 & disown
$ setsid sleep 604 < /dev/null > /dev/null 2>&1 &
$ ps -o pid,ppid,sid,stat,cmd -C sleep
    PID    PPID     SID STAT CMD
   4715    4706    4706 S    sleep 601
   4716    4706    4706 S    sleep 602
   4717    4706    4706 S    sleep 603
   4720       1    4720 Ss   sleep 604
After the connection dropped, I looked from a new session:
$ ssh bookstore-dev ps -o pid,ppid,sid,stat,cmd -C sleep
    PID    PPID     SID STAT CMD
   4716       1    4706 S    sleep 602
   4717       1    4706 S    sleep 603
   4720       1    4720 Ss   sleep 604
The job started with a plain & died. When the connection drops, sshd closes the session's PTY, bash receives SIGHUP and forwards SIGHUP to every job in its job list; sleep does not catch it, so it dies. nohup starts the process so that it ignores SIGHUP, disown takes the job off the list so bash does not signal it, and setsid starts the process in a new session, completely detached from the terminal. The three survivors now have PPID 1: their parent bash died and systemd adopted them.
The SigIgn line in /proc/<pid>/status tells you which signals a process ignores. When I started Bookstore.Api from inside a script with nohup ... &, this value was 0000000000001007: signals 1, 2, 3 and 13, that is SIGHUP (from nohup), SIGINT and SIGQUIT (the default for background jobs of a non-interactive shell) and SIGPIPE. That is why the kill -INT I sent to that process did nothing. This is the explanation for the "the application that stops with Ctrl-C does not react to kill -INT on the server" case.
None of these is a permanent solution. An application started with nohup does not come back after a reboot, does not restart when it crashes, and its log grows in a file. The permanent solution is systemd, the topic of the next post. If you want to watch a long-running migration or import by hand, the right tool is tmux; we ran the same drop experiment with tmux in the tmux post of the Terminal and Command Line series.
nice and renice
When several jobs want the CPU at the same time, the nice value affects which one goes first: -20 is the highest priority, 19 the lowest, the default is 0. In production it is used to keep a backup compression or report generation job from getting ahead of the web application:
$ nice -n 10 gzip -c /usr/lib/dotnet/shared/Microsoft.NETCore.App/*/System.Private.CoreLib.dll > /dev/null &
$ ps -o pid,ni,pri,stat,cmd -C gzip,dotnet
    PID  NI PRI STAT CMD
   4954   0  19 Sl   dotnet Bookstore.Api.dll --urls http://127.0.0.1:5000
   4982  10   9 RN   gzip -c /usr/lib/dotnet/shared/Microsoft.NETCore.App/10.0.15/System.Private.CoreLib.dll
$ renice -n 15 -p $(pgrep -x gzip)
4982 (process ID) old priority 10, new priority 15
$ renice -n 5 -p $(pgrep -x gzip)
renice: failed to set priority for 4982 (process ID): Permission denied
A regular user can lower the priority of their own process but cannot raise it back; that needs root. The N in STAT means low priority. nice is only CPU priority; for disk there is ionice. How the scheduler uses this value is in the scheduling post of the Operating System Fundamentals series.
Looking Inside a Process with /proc and lsof
In the second post we looked at /proc/<pid>/environ and cwd. Open files are in the fd folder:
$ PID=$(pgrep -f "^dotnet Bookstore.Api.dll")
$ sudo ls -l /proc/$PID/fd | head -5
total 0
lr-x------ 1 bookstore bookstore 64 Nov 14 15:01 0 -> /dev/null
l-wx------ 1 bookstore bookstore 64 Nov 14 15:01 1 -> /tmp/api.log
lrwx------ 1 bookstore bookstore 64 Nov 14 15:01 10 -> socket:[35937]
lr-x------ 1 bookstore bookstore 64 Nov 14 15:01 100 -> /usr/lib/dotnet/shared/Microsoft.AspNetCore.App/10.0.15/Microsoft.Extensions.Logging.Debug.dll
$ sudo ls /proc/$PID/fd | wc -l
203
$ sudo lsof -a -p $PID -i
COMMAND  PID      USER   FD   TYPE DEVICE SIZE/OFF NODE NAME
dotnet  4954 bookstore  174u  IPv4  35216      0t0  TCP localhost:5000 (LISTEN)
$ grep -E "^(State|PPid|Threads|VmRSS|SigIgn)" /proc/$PID/status
State:	S (sleeping)
PPid:	4950
VmRSS:	   73392 kB
Threads:	18
SigIgn:	0000000000001000
0, 1 and 2 are stdin, stdout and stderr: stdin is attached to /dev/null, stdout to the log file. The application has 203 files open; most are the runtime's .dll files and sockets. When you get a "Too many open files" error, look first at this number, then at Max open files in /proc/$PID/limits. lsof -p gives the same list with type, size and inode; -a -p $PID -i shows only that process's network connections: the application listens only on localhost:5000. That is the process-side answer to the "who listens on which port" question of the eighth post. Because I started this last run from a script but with job control on, SigIgn shows only SIGPIPE.
Production Notes
Tune the graceful shutdown time to your deploy. By default .NET waits 30 seconds for in-flight requests; systemd's default stop timeout is 90 seconds, Docker's is 10 seconds. If you have long-running report or file upload requests, think about these times together: if the orchestrator's timeout is shorter than the application's, SIGKILL arrives before .NET finishes and it is as if graceful shutdown never ran. The details are in the systemd post of the Web Servers and Hosting series and the container lifecycle post of the Docker series.
Watch the process and its behavior by measuring. Instantaneous %CPU in top can mislead; application startup and the first requests show high values for a short time. When diagnosing a problem, take several samples or move to tools that measure at intervals, such as pidstat (tenth post). For the thread pool, GC and exception counts inside .NET you need dotnet-counters; it is covered in the hang and slowness post of the Debugging and Problem Solving series.
Common Pitfalls
Trying to kill a zombie with kill. A zombie is the entry left in the process table by a process that has exited but whose exit code has not yet been read (reaped) by its parent. Since it is already dead, it does not respond to signals:
$ bash -c "sleep 1 & exec sleep 60" &
$ ps -o pid,ppid,stat,cmd -p 5244 --ppid 5244
    PID    PPID STAT CMD
   5244    5216 S    sleep 60
   5246    5244 Z    [sleep] <defunct>
$ kill -9 5246; sleep 1; ps -o pid,ppid,stat,cmd -p 5246
    PID    PPID STAT CMD
   5246    5244 Z    [sleep] <defunct>
$ kill 5244; sleep 1; ps -o pid,stat,cmd -p 5246 || echo 'zombie gone'
    PID STAT CMD
zombie gone
Here bash started a child and then replaced itself with sleep 60 (exec); since sleep does not know to wait for children, the child that died stayed a zombie. kill -9 did not help; when we killed the parent, the zombie passed to systemd and systemd cleaned it up right away. In real life the fix is to fix the parent: code that starts child processes (Process.Start in .NET) should wait for the child to finish with WaitForExit or the Exited event. A few zombies are harmless; if their number keeps growing, there is a bug heading toward running out of PIDs.
Trying to kill a process in D state. A process in uninterruptible sleep is waiting inside the kernel for an I/O to finish, and no signal, kill -9 included, is handled until that I/O completes. A hung NFS mount or a failing disk are typical causes. Look at the resource it waits for, not at the process.
pkill -f and pgrep -f catching too much. While preparing this post I ran a line like ssh bookstore-dev '... pkill -f "dotnet Bookstore.Api.dll"; rm -rf ...' on the remote server and the rm never ran. The reason: the command line of the bash -c that SSH started on the remote side contained the same text, so pkill killed its own shell along with the application. Anchor the pattern with something like ^dotnet, check with pgrep -a first, or best of all get the PID from systemd.
Making kill -9 the first choice. The application cannot write its log, cannot close open transactions and connections properly, and cuts off in-flight requests. Even for a process that will not die, send TERM first and wait a few seconds.
A Small Experiment
★☆☆ On your own VM, start Bookstore.Api with sudo -u bookstore, find its place in the tree with ps -ef --forest and note the VIRT and RES values in top. How does RES change after the first few requests?
★★☆ Send the slow report request and then send the application kill -TERM, kill -HUP and kill -9 in turn. Compare the HTTP code of the request and the last lines of the application's log. Then start the application with nohup, read SigIgn in /proc/<pid>/status and try kill -HUP again.
★★★ Do the SSH drop experiment yourself: in one session start four jobs with a plain &, nohup, disown and setsid, then kill the ssh process on your laptop or cut your network connection. From a new session, check which ones survived and their PPIDs. Repeat the experiment connecting from a shell in WSL.
We still start the application by hand: we have to rely on nohup for it to survive a dropped SSH connection, and on nobody for it to come back after a reboot. In the next post we hand Bookstore over to systemd: managing it with systemctl, changing packaged unit files with drop-in overrides, timers and cron.