

Types of Performance Testing and Goals: Load, Stress, Spike, Soak, Breakpoint and From SLO to Acceptance Criteria
Each performance test type answers its own question: smoke shows the script works, average load the normal day, stress the peak, spike a sudden jump, soak what happens after hours and breakpoint the capacity limit. We derive acceptance criteria from an SLO as load, duration and limits, compute virtual users with Little's Law and show with real k6 runs on Bookstore how a closed model reduces load on its own and hides the problem when the system slows down.
Version note: The code in this post was built and run with .NET 10; the load tests were run with k6 2.4.0 against Bookstore.Api and SQL Server 2025 on Docker Compose.
Guess First
Bookstore, the online bookstore used as the shared example across this site's series, is getting ready for campaign week. Emre from the team puts 500 k6 virtual users (VUs) on the book details endpoint; each user gets a response, thinks for about a second and looks at another book. His report says: "No errors at 500 users, p95 944 ms." Ayşe tests the same API on the same machine so that 500 new requests arrive every second. Do you think her report comes out better than Emre's, worse, or the same?
Second question: while the API is healthy, how many virtual users does k6 need to serve 500 requests per second? 500, 50, fewer? Both answers come from real runs in this post. First, though, let us be clear about which questions performance testing answers, because a correct number for the wrong question misleads too.
Every Test Type Answers One Question
Functional tests ask "does it work correctly?". The general map of test types is in the first post of the Test Strategy series ("Why We Write Tests"). Performance testing asks something else: does it work at this load, within this time and with this error rate? "We did a load test" says nothing on its own. You have to say at what load, for how long and to see what. That is why we separate the types by their load profile:
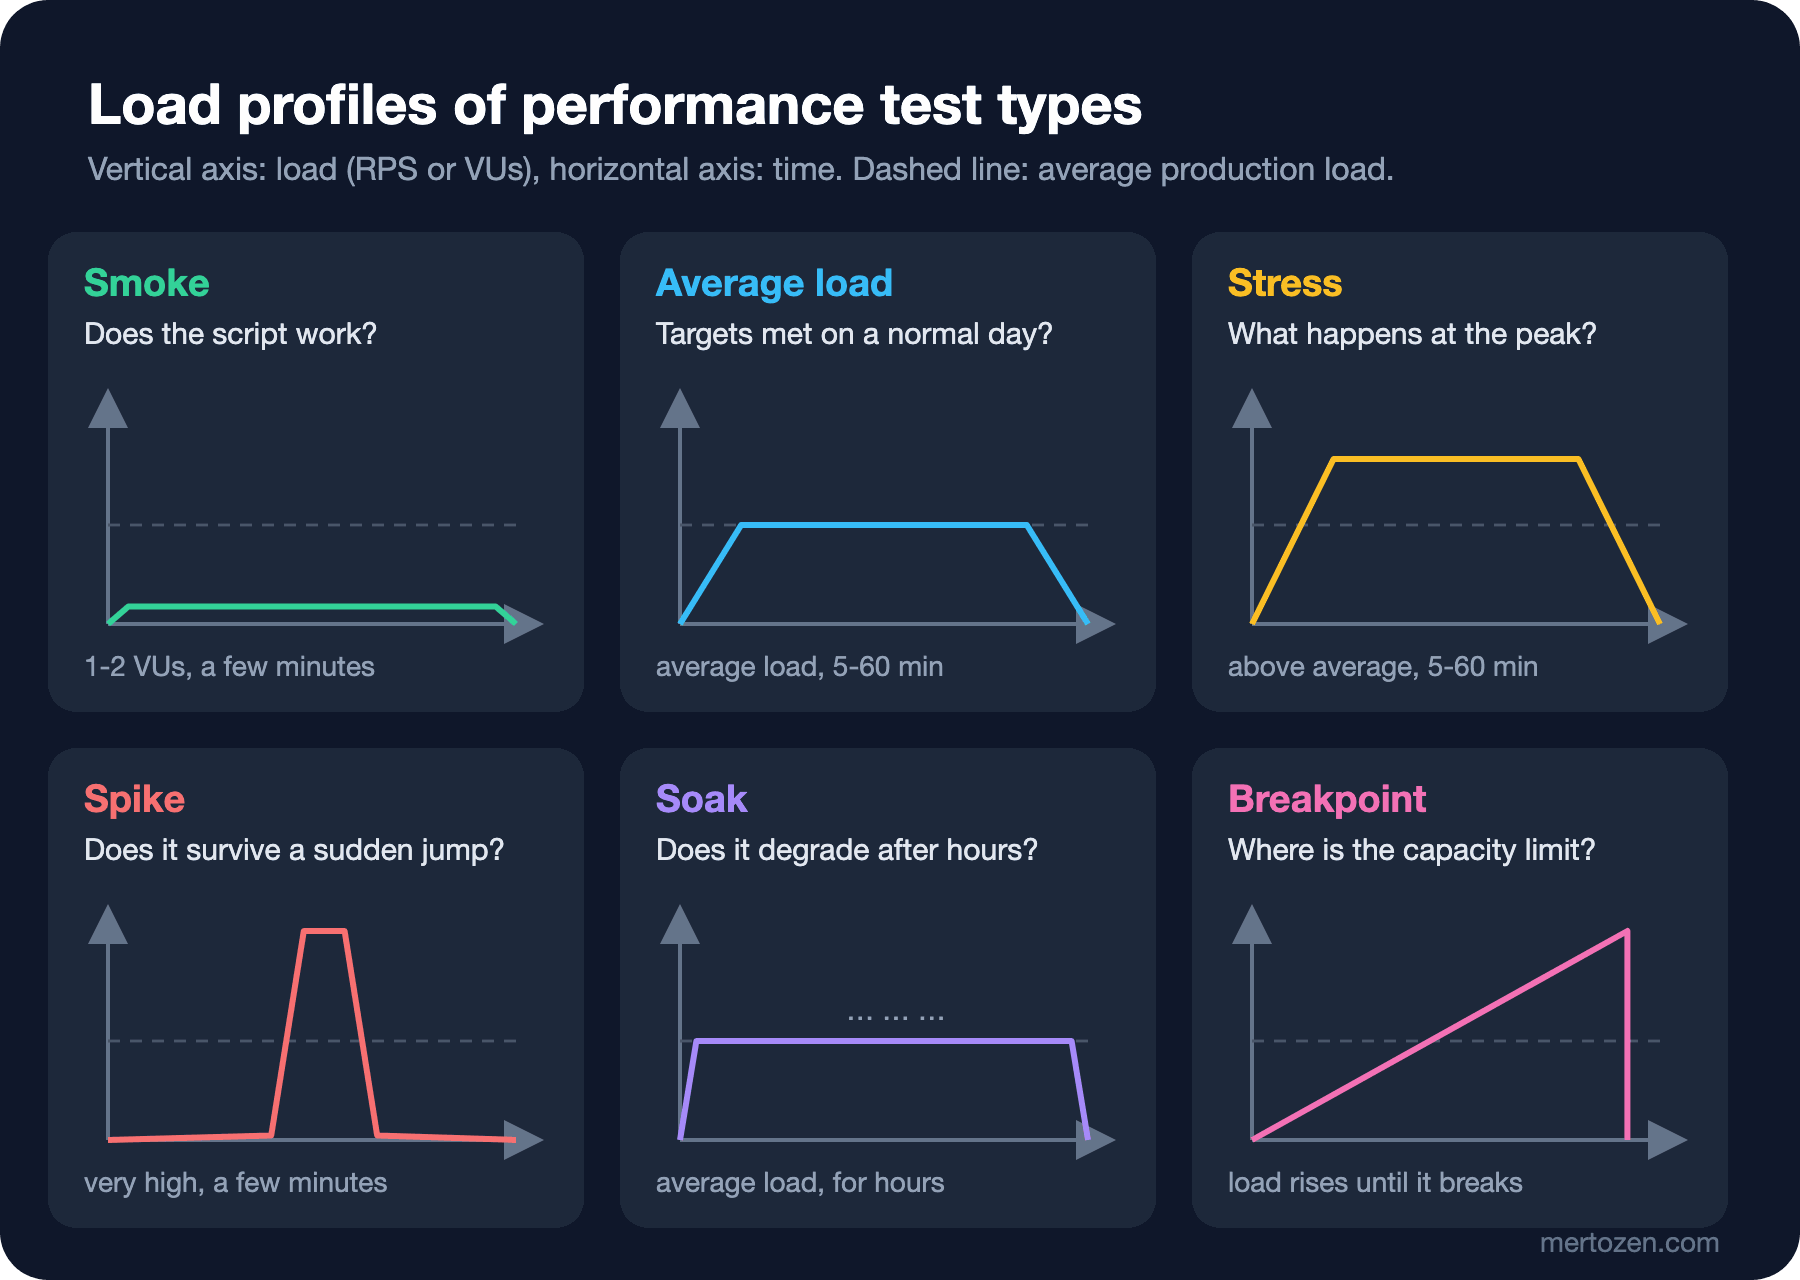
A smoke test asks whether the script and the environment work: one or two virtual users, a few iterations. The goal is not to measure; it is to see whether the URL is wrong, the test data is loaded and a token can be obtained. It always runs before a long test, and it is cheap enough to run on every pull request (PR). Our first script for Bookstore is this one:
import http from 'k6/http';
import { check, group, sleep } from 'k6';

// Smoke test: 1 VU, a few iterations. Question: does the script and the system work at all?
const BASE_URL = __ENV.BASE_URL || 'http://localhost:5080';

export const options = {
    vus: 1,
    iterations: 10,
    thresholds: {
        http_req_failed: ['rate==0'],
        checks: ['rate==1'],
    },
};

export default function () {
    let isbn;
    group('browse', () => {
        const list = http.get(`${BASE_URL}/api/books?pageSize=12`);
        check(list, { 'list is 200': (r) => r.status === 200 });
        isbn = list.json('items.0.isbn');
        const book = http.get(`${BASE_URL}/api/books/${isbn}`, { tags: { name: 'GET /api/books/{isbn}' } });
        check(book, { 'book is 200': (r) => r.status === 200 });
    });
    group('checkout', () => {
        const cart = http.post(`${BASE_URL}/api/carts`, null);
        check(cart, { 'cart is 201': (r) => r.status === 201 });
        const cartId = cart.json('id');
        const params = { headers: { 'Content-Type': 'application/json' } };
        const item = http.put(`${BASE_URL}/api/carts/${cartId}/items/${isbn}`, JSON.stringify({ quantity: 1 }),
            { ...params, tags: { name: 'PUT /api/carts/{id}/items/{isbn}' } });
        check(item, { 'item is 200': (r) => r.status === 200 });
        const order = http.post(`${BASE_URL}/api/orders`,
            JSON.stringify({ cartId, customerName: 'Ada Lovelace', customerEmail: 'ada@example.com' }), params);
        check(order, { 'order is 201': (r) => r.status === 201 });
    });
    sleep(1);
}
█ THRESHOLDS
checks
✓ 'rate==1' rate=100.00%
http_req_failed
✓ 'rate==0' rate=0.00%
█ TOTAL RESULTS
checks_total.......: 50 4.707097/s
checks_succeeded...: 100.00% 50 out of 50
...
http_req_duration..............: avg=11.92ms min=1.77ms med=7.85ms max=80.48ms p(90)=11.28ms p(95)=53.63msDo not make decisions from a smoke test's timings: with 50 requests, p95 moves with a few slow ones. The only answer you want from a smoke test is "yes, it works".
An average-load test asks whether the targets hold on a normal day: you apply the average production load for 5 to 60 minutes. A stress test asks the same for the peak: two or three times the average, as on a campaign evening. A spike test tries the moment when load jumps within seconds, for example after a push notification or a TV ad. What you really want to see is how autoscaling, the connection pool and the queues react to the sudden load, and whether the system recovers once the load drops. A soak test applies the average load for hours and looks for problems a short test does not show: memory leaks, a connection pool that drains slowly, a filling disk, expiring tokens. How to find a memory leak on the heap is covered in the "Profiling and Diagnostics in .NET" series post "Hunting Memory Leaks: dotnet-gcdump, Heap Snapshot Diffing and Common Leak Patterns". A breakpoint test raises the load until the system breaks and finds the capacity limit. We draw the throughput-latency curve needed to read that limit correctly in post 06. Whether one VU equals one real user depends, as we will see shortly, on the workload model.
| Type | Question it answers | Load and duration | When |
|---|---|---|---|
| Smoke | Do the script and the environment work? | 1-2 VUs, minutes | On every PR, before every test |
| Average load | Do the targets hold on a normal day? | Average load, 5-60 min | Short version on PRs, full one nightly |
| Stress | What happens at the peak? | 2-3 times the average, 5-60 min | Before campaigns and big releases |
| Spike | Does it survive a sudden jump and recover? | Very high, a few minutes | Planned, when autoscaling changes |
| Soak | Does it degrade after hours? | Average load, for hours | Weekly or before a release |
| Breakpoint | Where is the capacity limit? | Load rising until it breaks | Rarely, when the architecture changes |
From SLO to Acceptance Criteria
"It should be fast" is not an acceptance criterion. The criterion should come from a target the product already commits to: an SLO. Let Bookstore's catalog SLO be this: 95 percent of book details requests under 300 ms and fewer than 0.5 percent failed responses. How an SLO is chosen and how the error budget is computed is the topic of the upcoming SRE and Production Incidents series post "SLOs and Error Budgets: Setting Targets, the Math of Nines and Error Budget Policy". What we need is this: an SLO does not state a load. "p95 under 300 ms" is the same sentence at 5 requests per second and at 5,000.
So an acceptance criterion has three parts: at what load (RPS and traffic mix), for how long and with which limits. The load estimate comes from capacity math. How to go from daily visitors to requests per second is in the System Design series post "Back-of-the-Envelope Estimation". Let Bookstore's campaign-week estimate be 200 requests per second on book details. The criterion reads: "At 200 requests per second, for 10 minutes, book details p95 stays under 300 ms and the error rate under 0.5 percent." In k6 the last part becomes thresholds:
export const options = {
    scenarios: { [MODEL]: scenarios[MODEL] },
    // Acceptance criteria derived from the SLO: p95 under 300 ms, under 0.5% errors.
    thresholds: {
        http_req_duration: ['p(95)<300'],
        http_req_failed: ['rate<0.005'],
    },
};
If a threshold is crossed, k6 marks the test as failed and exits with code 99; that is the behavior we use as a CI gate in post 04. The load and the duration live in the scenario. Keep one more thing in mind: an SLO is measured in production over weeks, while a load test is a single run under a single condition. Passing the test does not prove you will meet the SLO. It says that at this load, in this environment, we saw nothing that contradicts the target. If you barely pass in the test, you will spend the error budget on the first busy day in production, so keeping test limits a little tighter than the SLO is a common choice.
Little's Law: How Many Virtual Users Do You Need?
We defined the load as "200 requests per second", but k6 is usually told a number of virtual users. The rule that connects the two comes from queueing theory: Little's Law, the equation L = λW that John Little proved in 1961. In a stable system, the number of items inside at the same time (L) equals the arrival rate (λ) times the average time an item spends inside (W). In load-testing terms: concurrent users = throughput × duration of one iteration.
If a user sends a request, gets the response in about 50 ms and thinks for one second, one iteration takes 1.05 seconds. For 200 requests per second you need 200 × 1.05 = 210 virtual users. I checked the math with a real run: 500 virtual users, each waiting a random 0.5 to 1.5 seconds after a response. The average iteration duration measured by k6 was 1 second and the throughput 491 requests per second, very close to the 500/1 = 500 the formula expects. The small difference comes from all users starting at once at the beginning of the test.
The answer to the second guess question follows from the same law. If requests arrive at a fixed 500 per second without thinking, and the healthy API answers in 1.4 ms on average, the number of requests inside at the same time is 500 × 0.0014 = 0.7. That is exactly what k6 showed: the 500 RPS test used at most 1 VU. The number of virtual users is not an input, it is an output: throughput times duration. When the system slows down, the same throughput needs more concurrent users. That is exactly the topic of the next section.
Closed and Open Workload Models
You can define load in two ways. In a closed model there is a fixed number of users; each waits for the response, thinks, then sends the next request. A new request only arrives after the previous one finishes. In an open model requests arrive at a rate independent of the system: 500 people per second enter the site, and nobody outside waits because the server is slow. In k6 a closed model is built with VU-based executors such as constant-vus and ramping-vus, an open model with constant-arrival-rate and ramping-arrival-rate. I compared the two in the same script:
const scenarios = {
    closed: {
        executor: 'constant-vus',
        vus: Number(__ENV.VUS || 200),
        duration: DURATION,
    },
    open: {
        executor: 'constant-arrival-rate',
        rate: Number(__ENV.RATE || 200),
        timeUnit: '1s',
        duration: DURATION,
        preAllocatedVUs: 50,
        maxVUs: Number(__ENV.MAX_VUS || 1000),
    },
};

export function setup() {
    const res = http.get(`${BASE_URL}/api/books?pageSize=50`);
    return { isbns: res.json('items').map((b) => b.isbn) };
}

export default function (data) {
    const isbn = data.isbns[Math.floor(Math.random() * data.isbns.length)];
    const res = http.get(`${BASE_URL}/api/books/${isbn}`, { tags: { name: 'GET /api/books/{isbn}' } });
    check(res, { 'status is 200': (r) => r.status === 200 });
    if (MODEL === 'closed') {
        // Closed model: the user waits for the response, thinks (0.5-1.5 x THINK seconds), then sends the next request.
        sleep(THINK_TIME * (0.5 + Math.random()));
    }
}
Bookstore.Api runs as a Release build in a container limited to 2 CPUs and 1 GB of memory. I first ran both models for a minute each against the healthy API, then lowered the container's CPU limit to 0.25, slowing the system down on purpose, and repeated both tests:
k6 run -e MODEL=closed -e VUS=500 models.js
k6 run -e MODEL=open -e RATE=500 models.js

docker update --cpus 0.25 $(docker compose ps -q api)
k6 run -e MODEL=closed -e VUS=500 models.js
k6 run -e MODEL=open -e RATE=500 models.js| Run | Throughput | p50 | p95 | dropped_iterations | Max VUs |
|---|---|---|---|---|---|
| Healthy, closed (500 VUs) | 491/s | 1.18 ms | 2.97 ms | n/a | 500 |
| Healthy, open (500/s) | 500/s | 1.16 ms | 2.14 ms | 0 | 1 |
| Slow, closed (500 VUs) | 406/s | 47 ms | 944 ms | n/a | 500 |
| Slow, open (500/s) | 479/s | 16 ms | 1.51 s | 834 | 827 |
While the system is healthy, both models say the same thing. The difference shows up when it slows down. In the closed test users waited longer for responses as the system slowed, the average iteration grew to 1.21 seconds and k6 sent fewer requests on its own: 500/1.21 = 413, measured 406. So the report that says "we tested with 500 users" does not tell you that the server actually saw 17 percent less load. The load shrank in proportion to the size of the problem, and p95 stayed at 944 ms.
In the open test the arrival rate stayed fixed. As responses got slower, the number of requests waiting inside at the same time grew; k6 opened 827 VUs for them and could not start 834 iterations at all (dropped_iterations). p95 was 1.51 seconds. Ayşe's report came out worse because it is closer to reality: people coming to the site on a campaign evening do not delay their visit because the API is slow. That is the answer to the first guess question. The threshold result of the same run looks like this:
  █ THRESHOLDS

    http_req_duration
    ✗ 'p(95)<300' p(95)=1.51s

    http_req_failed
    ✓ 'rate<0.005' rate=0.00%
...
    dropped_iterations.............: 834    13.699946/s
    vus............................: 827    min=0          max=827
    vus_max........................: 876    min=50         max=876
level=error msg="thresholds on metrics 'http_req_duration' have been crossed"
You also need to know where the closed model belongs. It is the right model for systems where the number of users really is fixed: an internal app used by a 50-person call center, a batch job with a fixed number of workers, a client with a limited connection pool. For traffic that arrives from outside, like Bookstore's catalog and checkout, use the open model. The way a closed model hides a slowdown from the measurement is also known in the literature as coordinated omission; we measure its effect on percentiles in detail in post 06.
Test Environment: How Close to Production?
What makes a result meaningful for production is the environment. Bookstore's load-test environment is a two-container Compose file: SQL Server and the API built in Release mode. The API's CPU and memory limits are kept the same as the production container. A result from an unlimited container says nothing about a two-CPU pod:
  api:
    build:
      context: .
      dockerfile: src/Bookstore.Api/Dockerfile
    environment:
      ConnectionStrings__BookstoreDb: "Server=sql;Database=BookstoreDb;User Id=sa;Password=${SA_PASSWORD};TrustServerCertificate=True"
      Database__MigrateOnStartup: "true"
      ASPNETCORE_HTTP_PORTS: "8080"
    ports:
      - "${API_PORT:-5080}:8080"
    depends_on:
      sql:
        condition: service_healthy
    cpus: ${API_CPUS:-2}
    mem_limit: 1g
# PowerShell
$env:SA_PASSWORD = "<strong-password>"
docker compose up -d --build
k6 run load/k6/smoke.jsThe numbers in this post were taken on a single machine, with k6 and the API sharing the same hardware. The absolute values are machine-specific; they will be different on yours. What carries over are the ratios and the behavior: the closed model reducing the load on its own, the queue growing in the open model. For closeness to production, check four things: the same build and configuration (a Debug build or a Debug log level left on ruins the result), the same resource limits, a data size close to production (the topic of the next post) and isolation. In a shared test environment another team's test ruins your result. Other containers were running on the machine during these tests; if you want repeatable numbers, have the environment to yourself or at least repeat the test a few times.
One more rule: do not send load to a system you do not own without permission. Bookstore's payment provider, e-mail service, CDN or a partner API is not your test environment. Their sandbox environments are for integration testing, not load testing. We replace these dependencies with stubs in post 02. When you load your own system running in the cloud, check the provider's terms of use too; some providers want advance notice for certain kinds of tests.
Production Notes
Plan up front which test runs when, otherwise they either never run or everything runs on every PR and the pipeline slows down. An arrangement that works: smoke and one or two minutes of average load on every PR; the full average load nightly; stress and spike before campaigns and big releases; soak weekly; breakpoint when the architecture changes. We use the JSON output to store and compare results in post 03 and set up the CI integration in post 04.
Load testing in production is possible but it is a separate decision. You share resources with real users, test data can leak into real reports, and side effects such as payments and e-mails become real. If you do it, do it at a low-traffic hour, gradually, with a stop criterion defined (for example abortOnFail when the error rate exceeds 1 percent) and with the relevant teams informed.
Finally, watch the machine generating the load as well. If k6 itself saturates the CPU, the latency you measure comes from the client sending requests late. We cover this trap separately in post 03.
Common Pitfalls
- Setting a latency target without a load: the criterion "p95 under 300 ms" must say at which RPS and with which traffic mix.
- Testing traffic that arrives from outside with a closed model: as the system slows down, the load drops on its own and the problem looks small.
- Not reading
dropped_iterationsin an arrival-rate test: every iteration that could not start is a user the system could not serve. - Treating a VU count as capacity: "it handles 1,000 users" means nothing without the think time and the iteration duration.
- Measuring in an environment without resource limits and carrying the result over to production.
- Drawing conclusions from a smoke test's timings.
- Sending load to a third-party system such as a payment provider without permission, even to its sandbox.
A Small Experiment
★☆☆ Run the smoke test, then raise iterations from 10 to 100. How did p95 change? Show with your own numbers why a smoke test should not drive timing decisions.
★★☆ Run the closed model in models.js with THINK=0 (no think time) and 20 VUs. By Little's Law the throughput should be the VU count divided by the average request duration. Compare your measured http_reqs with your calculation.
★★★ Lower the API's CPU limit to 0.5 and, in the open model, start RATE at 100 and raise it by 100 to find the rate where dropped_iterations first appears. How many VUs does the closed model need to reach the same throughput at that limit? Connect the two numbers with Little's Law.
The tests in this post always went to a single endpoint and a 20-book catalog; real traffic is not like that. In the next post we bring the workload model closer to reality by setting up Bookstore's traffic mix, think time, 40,000 books of test data, cache state and a stub that stands in for the payment provider.