

Debug Configurations in the IDE: launchSettings.json, launch.json and Debugging a .NET API and Angular Together
To debug the API and Angular from one F5 you use launch.json compounds in VS Code, a compound run configuration in Rider and a multi-project launch profile in Visual Studio; in a real run, dotnet run without a profile started the app on port 5000 in Production. launchSettings.json profiles, a background task that waits for ng serve, proxy.conf.json, source maps, HMR, attaching to processes and debugging tests.
Version note: The code in this post was built and run with .NET 10 SDK (Software Development Kit) 10.0.402, ASP.NET Core 10, Angular 22.2 (Angular CLI (Command Line Interface) 22.2.6) and Node.js 24; the dotnet run, ng serve, proxy and HMR (Hot Module Replacement) output comes from real runs. Visual Studio Code (VS Code) 1.145 is installed on this machine, but to avoid installing debugger extensions into the user profile the launch.json compound was not run interactively; the files were written from the documentation and validated as JSON (JavaScript Object Notation), and their parts (the launch profile, the log lines the task waits for, the proxy) were tried one by one with the CLI. Visual Studio 2026 and Rider 2026.2 are described from the official documentation.
Guess First
A new developer on Bookstore follows the README: dotnet run in one terminal, ng serve in the other. Angular opens but the book list is empty, and the browser console shows a 404 for /api/books. A teammate who starts the API (Application Programming Interface) with F5 in Visual Studio says "works on my machine". On the teammate's machine, on which port and in which environment does the API start, and on the new developer's? And where does Angular send the /api request?
This post is not about the debugger itself but about the configuration that starts it. Debugger features such as breakpoint types, data breakpoints and Parallel Stacks are in the fifth and sixth posts of the Debugging and Problem Solving series; the goal here is to bring up the right processes with the right settings from one key.
launchSettings.json: Profiles and Environment Variables
An ASP.NET Core project's Properties/launchSettings.json is read only on the development machine and is the common language of the three IDEs (Integrated Development Environment): Visual Studio shows its profiles in the F5 menu, Rider in the Launch Settings Profile run configurations it creates on its own, VS Code in the C# Dev Kit run/debug list; dotnet run uses the same file too. We wrote two profiles for the Bookstore API:
{
  "$schema": "https://json.schemastore.org/launchsettings.json",
  "profiles": {
    "http": {
      "commandName": "Project",
      "dotnetRunMessages": true,
      "launchBrowser": false,
      "applicationUrl": "http://localhost:5046",
      "environmentVariables": {
        "ASPNETCORE_ENVIRONMENT": "Development"
      }
    },
    "staging-local": {
      "commandName": "Project",
      "launchBrowser": false,
      "applicationUrl": "http://localhost:5047",
      "environmentVariables": {
        "ASPNETCORE_ENVIRONMENT": "Staging",
        "Shipping__Provider": "FakeCarrier"
      }
    }
  }
}
The double underscore in Shipping__Provider separates the configuration hierarchy in environment variables; in code it is read as config["Shipping:Provider"]. The API has an endpoint that returns the environment and this value:
app.MapGet("/api/info", (IHostEnvironment env, IConfiguration config) => new
{
    Environment = env.EnvironmentName,
    ShippingProvider = config["Shipping:Provider"] ?? "(not set)",
    Pid = Environment.ProcessId
});
We ran the two profiles at the same time in two separate terminals (taking the relevant lines from the logs):
$ dotnet run --project api --launch-profile http
Using launch settings from api/Properties/launchSettings.json...
info: Microsoft.Hosting.Lifetime[14]
      Now listening on: http://localhost:5046
info: Microsoft.Hosting.Lifetime[0]
      Hosting environment: Development

$ dotnet run --project api --launch-profile staging-local
Using launch settings from api/Properties/launchSettings.json...
info: Microsoft.Hosting.Lifetime[14]
      Now listening on: http://localhost:5047
info: Microsoft.Hosting.Lifetime[0]
      Hosting environment: Staging

$ curl -s http://localhost:5046/api/info
{"environment":"Development","shippingProvider":"(not set)","pid":16777}
$ curl -s http://localhost:5047/api/info
{"environment":"Staging","shippingProvider":"FakeCarrier","pid":16776}
Running without a profile, with --no-launch-profile, changes the picture:
info: Microsoft.Hosting.Lifetime[14]
      Now listening on: http://localhost:5000
info: Microsoft.Hosting.Lifetime[0]
      Hosting environment: Production
The answer to Guess First is in these two outputs. The developer pressing F5 in the IDE runs with the first profile in launchSettings.json, on 5046 and in Development; someone who starts it in a way that doesn't read that file (a container, a published dll, a script without a profile) runs on 5000 and in Production. In Production the developer exception page is off, user secrets aren't read and the Development-only settings file isn't loaded; the same code behaves differently. That is why the README should name the profile: dotnet run --launch-profile http.
Multiple Processes in Visual Studio, Rider and VS Code
Starting a .NET API and the Angular dev server together has three names in the three IDEs.
In Visual Studio you right-click the solution, choose Multiple startup projects under Configure Startup Projects, and give each project Start, Start without debugging or None. The "Angular and ASP.NET Core" template sets this up for you. This setup can be saved as a multi-project launch profile; in Visual Studio 2026 you enable Enable Multi-Project Launch Profiles under Tools > Options > Preview Features. The profile is written to a .slnLaunch JSON file next to the solution; to the file meant for source control if Share Profile is checked, otherwise to a user-specific file.
In Rider you add a new Compound configuration under Run > Edit Configurations (Alt+Shift+F10, then 0) and put the API's launch profile configuration and Angular's npm configuration into it. The docs warn that the start order of the configurations in a compound isn't guaranteed; if you need an order, add "Run Another Configuration" as a Before launch step to the configuration that should start last. With Store as project file checked, the configuration is written to the .run folder in the solution directory and can be committed to the repo.
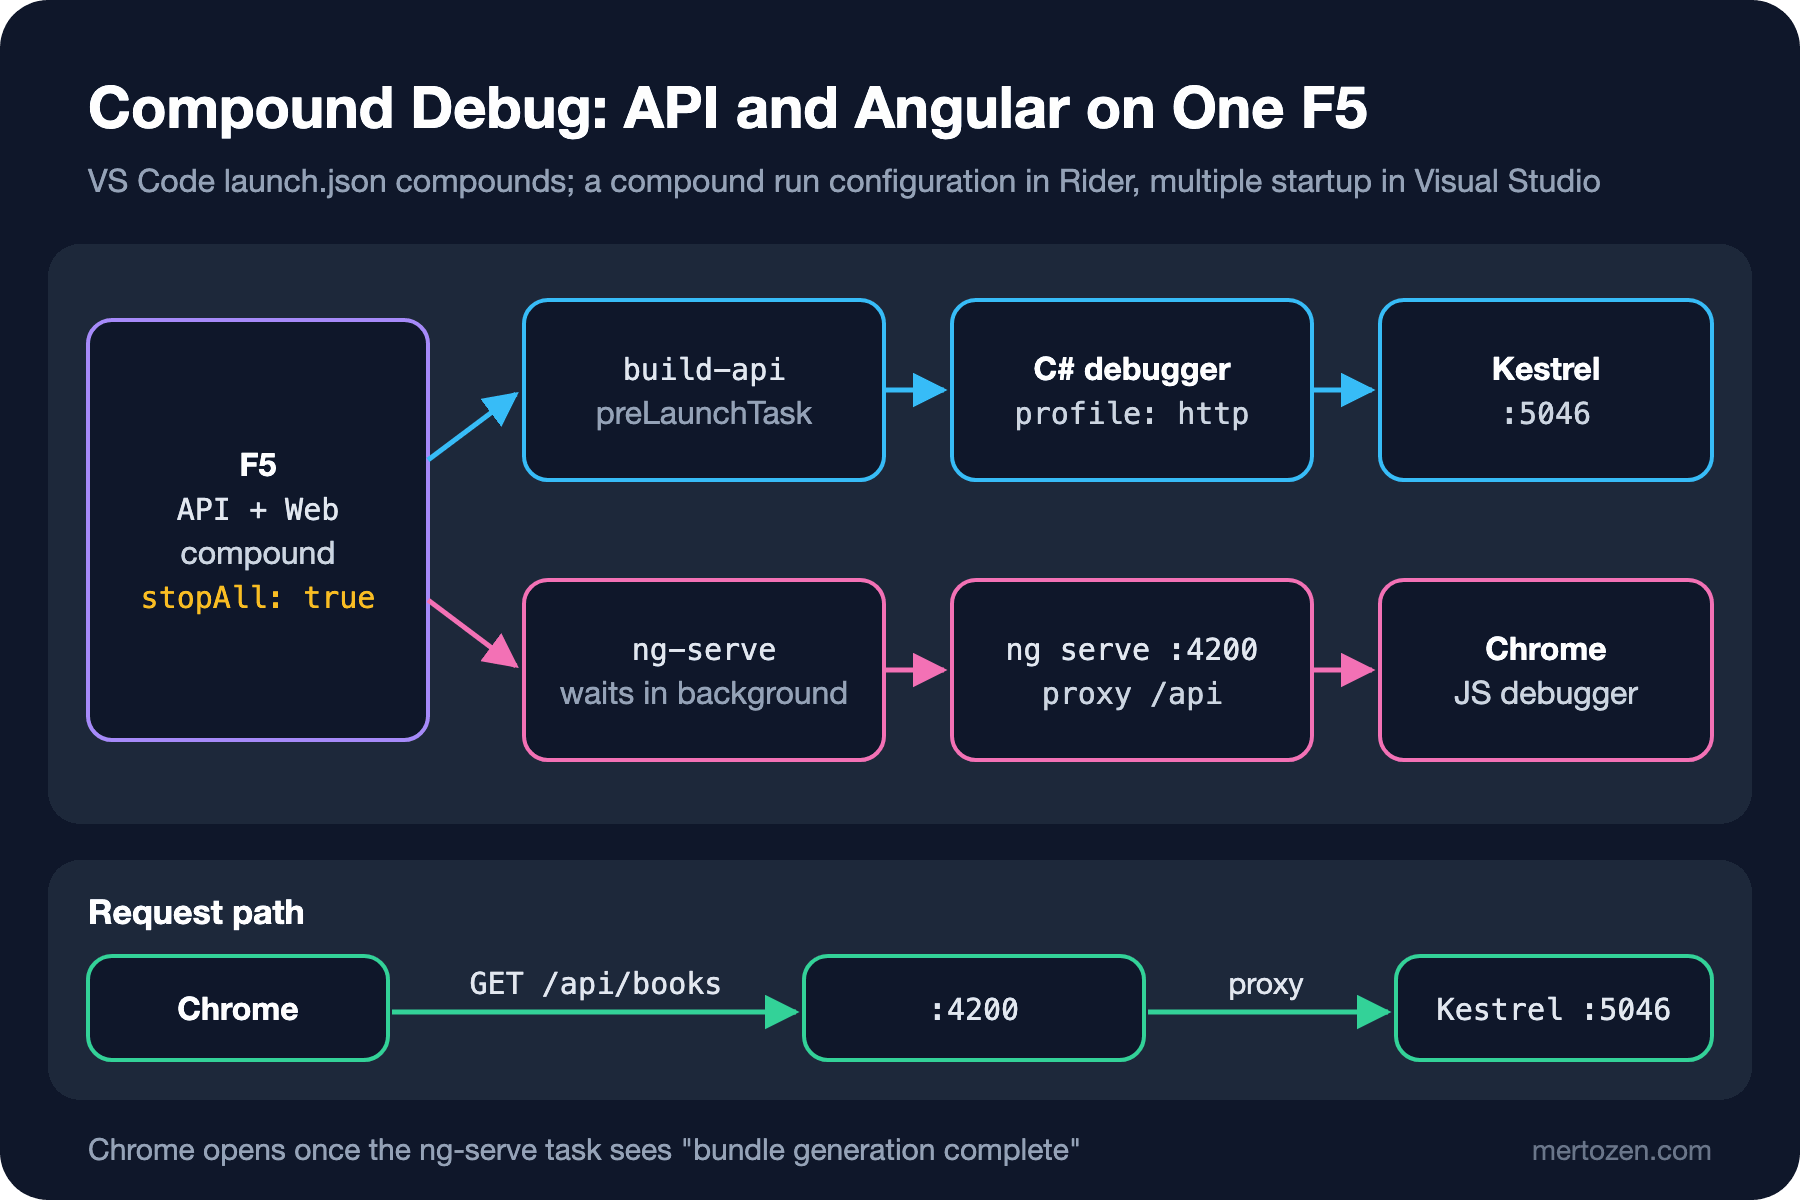
In VS Code the compounds array in .vscode/launch.json does the same:
{
  "version": "0.2.0",
  "configurations": [
    {
      "name": "API",
      "type": "coreclr",
      "request": "launch",
      "preLaunchTask": "build-api",
      "program": "${workspaceFolder}/api/bin/Debug/net10.0/Bookstore.Api.dll",
      "cwd": "${workspaceFolder}/api",
      "launchSettingsProfile": "http"
    },
    {
      "name": "Web (Chrome)",
      "type": "chrome",
      "request": "launch",
      "preLaunchTask": "ng-serve",
      "url": "http://localhost:4200/",
      "webRoot": "${workspaceFolder}/web"
    }
  ],
  "compounds": [
    {
      "name": "API + Web",
      "configurations": ["API", "Web (Chrome)"],
      "stopAll": true
    }
  ]
}
The coreclr type is the C# extension's debugger, and launchSettingsProfile makes it read the environment variables and URL (Uniform Resource Locator) settings of the profile in launchSettings.json; according to the docs this type supports only a subset of the file, and full support is in C# Dev Kit's dotnet type. If you use C# Dev Kit, the docs already recommend not writing a launch.json and using the configuration Dev Kit derives from the project; the moment you need a compound, though, you have to move to launch.json. The chrome type is VS Code's built-in JavaScript debugger. stopAll: true stops the other session when you stop one of them.
Tasks: Waiting for the Build and the Dev Server
The compound has two preLaunchTasks, and the second one has a special problem: ng serve never finishes. For VS Code to say "the task is done, now open Chrome", it has to know that the task runs in the background and when it is ready. isBackground and the problem matcher's background patterns provide that:
{
  "version": "2.0.0",
  "tasks": [
    {
      "label": "build-api",
      "type": "process",
      "command": "dotnet",
      "args": ["build", "${workspaceFolder}/api/Bookstore.Api.csproj"],
      "problemMatcher": "$msCompile"
    },
    {
      "label": "ng-serve",
      "type": "npm",
      "script": "start",
      "path": "web",
      "isBackground": true,
      "problemMatcher": {
        "owner": "typescript",
        "pattern": "$tsc",
        "background": {
          "activeOnStart": true,
          "beginsPattern": { "regexp": "Changes detected" },
          "endsPattern": { "regexp": "bundle generation (complete|failed)" }
        }
      }
    }
  ]
}
We didn't make these patterns up: Angular CLI 22 writes the same two into the .vscode/tasks.json of a project created with ng new. To see what they match, we ran the dev server; npm start opens with the proxy thanks to the "proxyConfig": "proxy.conf.json" we added to angular.json:
Application bundle generation complete. [0.532 seconds] - 2026-11-08T12:02:23.445Z

Watch mode enabled. Watching for file changes...
NOTE: Raw file sizes do not reflect development server per-request transformations.
  ➜  Local:   http://localhost:4200/
endsPattern catches the first line, and VS Code opens Chrome at that moment. If the dev server's output changes (if the message differs in the next Angular version), the task never "finishes" and Chrome never opens; in that case these two regexes are the first place to look.
The Angular Side: Proxy, Source Maps and HMR
The second cause of the 404 in Guess First is the proxy. The Angular dev server is on 4200, the API on 5046; when Angular code requests /api/books with a relative address, the request goes to 4200. The file that forwards it to the API:
{
  "/api": {
    "target": "http://localhost:5046",
    "secure": false
  }
}
$ curl -s http://localhost:4200/api/books
[{"isbn":"978-0135957059","title":"The Pragmatic Programmer","price":49.90},{"isbn":"978-0132350884","title":"Clean Code","price":42.50}]The request went to 4200 and the answer came from Kestrel. The proxy lets you develop without configuring CORS (Cross-Origin Resource Sharing); in production a reverse proxy or serving from the same origin does the same job. The port in target must match the applicationUrl in launchSettings.json; changing one and forgetting the other is the most common way this setup breaks.
For breakpoints to bind in TypeScript files you need source maps. In the development configuration angular.json says "sourceMap": true; we compared the output of the two builds:
$ npx ng build --configuration development
$ ls dist/bookstore-web/browser
favicon.ico
index.html
main.js
main.js.map
styles.css
styles.css.map
$ npx ng build
$ ls dist/bookstore-web/browser
favicon.ico
index.html
main-6LWL5HIQ.js
styles-5INURTSO.css
The production build has no .map files; that is why you always debug with the development configuration. If a breakpoint in VS Code is grey and shows "Unbound breakpoint", the cause is usually webRoot: if the Angular project lives in the web folder rather than the repo root, webRoot has to point there too.
When we changed the template on the running dev server, Angular updated the component without reloading the page:
❯ Changes detected. Rebuilding...
✔ Changes detected. Rebuilding...
Application bundle generation complete. [0.056 seconds] - 2026-11-08T12:02:32.528Z

Component update sent to client(s).
When we changed the global styles.css, the output was Page reload sent to client(s).; not every change is applied with HMR. On the .NET side the counterpart is Hot Reload: the Hot Reload button in Visual Studio, Apply Hot Reload Changes in Rider (Ctrl+O, A in the default keymap), the csharp.experimental.debug.hotReload setting with C# Dev Kit in VS Code, and dotnet watch without an IDE. Its mechanism and limits were shown with real output in the fifth post of the Debugging series.
Attach to Process, Containers and Debugging Tests
You don't have to start everything under the debugger; you can attach to a running process later. In Visual Studio it is Debug > Attach to Process (Ctrl+Alt+P), in Rider Attach to Process (Ctrl+Alt+F5), in VS Code "Debug: Attach to a .NET 5+ or .NET Core process" from the Command Palette. Since Visual Studio 18.10 the Attach to Process window finds Podman containers next to Docker; to attach to an API inside a container you no longer need to set up a remote debugger separately.
Debugging tests is also a configuration job: Debug from Test Explorer in Visual Studio, Debug Unit Tests in Rider (Ctrl+;, D), and the debug button in C# Dev Kit's Test Explorer in VS Code. A test project's environment variables come from a .runsettings file or the test code, not from launchSettings.json; that is a common reason a setting that works in the API doesn't show up in a test.
In Production
launchSettings.json doesn't go to production and shouldn't. It isn't copied to the publish output; in production the environment is set by the environment variables of the container, App Service or orchestrator. Don't put a production connection string or a real API key in a profile: the file is in the repo.
Keep debug configurations the team shares in the repo: launchSettings.json, .vscode/launch.json and tasks.json, Rider's .run folder, Visual Studio's shared .slnLaunch file. Leave personal ones out (the user-specific .slnLaunch, workspace files in .vs and .idea).
Watch for port conflicts. On a microservices team every API needs its own applicationUrl; the Angular proxy, the Docker Compose file and orchestration tools such as Aspire must know the same ports. When a port changes in one place, update the others in the same commit.
Common Pitfalls
Running without a profile and assuming Development. Real output: with --no-launch-profile the app started on 5000 and in Production.
Not keeping the proxy's port in sync with the API. The port changes in launchSettings.json, proxy.conf.json still points to the old one; silent 504s or 404s start in Angular.
Writing the background task's end pattern wrong. If endsPattern doesn't match the dev server's real output, VS Code waits for the task to finish forever and Chrome never opens.
Trying to debug a production build. No source maps, hashed file names; breakpoints don't bind.
Looking for debugger features in the configuration. Conditional breakpoints, tracepoints and exception settings are the debugger's job, not the launch configuration's; they are in the Debugging series.
A Small Experiment
★☆☆ Add a second profile with ASPNETCORE_ENVIRONMENT=Staging to your own API's launchSettings.json and compare the "Hosting environment" lines in the logs of the two profiles with dotnet run --launch-profile.
★★☆ Add a proxy.conf.json to your Angular project, wire it up as proxyConfig in angular.json, and confirm with curl http://localhost:4200/api/... that the answer comes from the API. Then change the API's port and note the error message.
★★★ Adapt this post's launch.json and tasks.json to your own repo and debug the API and Angular together with a single F5; keep one breakpoint in an Angular service and one in an API endpoint. Build the same setup as a compound configuration in Rider or a multi-project launch profile in Visual Studio and add the file to the repo.
We have set up debug configurations in three IDEs. In the next post we take a closer look at VS Code: the difference between C# Dev Kit and the C# extension alone, the Angular Language Service, profiles, and Dev Containers that put a .NET 10 SDK and Node LTS (Long-Term Support) environment into the repo.