

Flow Metrics: WIP, Throughput, Work Item Age and Cycle Time

We compute the Kanban Guide's four mandatory metrics, WIP, Throughput, Work Item Age and Cycle Time, from six months of the Bookstore team's board data with a .NET 10 console app. We see why percentiles beat the average, how to read a cycle time scatterplot and an aging chart, why Work Item Age is the earliest warning, and how measuring from the Created date turns a p85 of 14 days into 79.
Version note: This post is based on version 2025.5 of The Kanban Guide; the metrics code was built with .NET 10 and run on the Bookstore team's sample board data.
Guess First
The 193 items the Bookstore team finished between May and October 2026 have an average cycle time of 11.4 days. The product owner is about to quote a customer a time for a new support request. If they say "11 days on average," roughly what share of customers will they keep that promise for? Half, three quarters, almost all?
Second question: on Friday morning, 30 October, there are 11 open items on the board. Which one is the riskiest: the biggest feature, the bug waiting in Code Review, or the item that has sat in In Dev for 19 days that nobody talks about? How would you see that with a metric?
The Guide's Four Flow Metrics
The Kanban Guide treats four flow metrics as the minimum, and the definitions are short. WIP (Work in Progress) is the number of items started but not finished. Throughput is the number of items finished per unit of time; the Guide stresses that it is an exact count, not an estimate. Work Item Age is the time elapsed from when an unfinished item started until now. Cycle Time is the time elapsed from when a finished item started until it finished.
Notice that two of them look at finished work and two at unfinished work. Cycle Time and Throughput describe the past: how long it took, how much got done. WIP and Work Item Age describe the present: how much work is open right now and how old it is. With the two backward-looking metrics you see what happened; with the two present-looking ones you see what is about to happen.
The Guide does not specify the unit of time or rounding. In practice the common convention is to use days as the unit and count work that starts and finishes on the same day as 1 day, not 0: cycle time = finish date - start date + 1. The documentation of ActionableAgile (the flow analytics tool Daniel Vacanti's team built) describes the calculation the same way; the +1 counts every calendar day spent on the work and prevents zero-day cycle times. We chose this convention in the Bookstore DoW (Definition of Workflow) in post 02. Which one you pick matters less than using the same one across the team.
Data: From Board History to CSV
All four metrics need one piece of data: the date each item entered each state. Jira and GitHub Projects keep this history, but their standard CSV (Comma-Separated Values) exports usually give the item's current status and its created/resolved dates. For state transition dates in Jira you have to pull the issue changelog, for example with the REST (Representational State Transfer) API (Application Programming Interface) and its expand=changelog parameter, and flatten it into a table. This post skips that step and assumes we have a file like this:
Id,Title,Type,Created,Ready,InDev,CodeReview,Test,ReadyToDeploy,Done,BlockedDays
BS-1001,Fix VAT rounding on invoice PDF,Bug,2026-04-07,2026-05-04,2026-05-04,2026-05-05,2026-05-07,2026-05-08,2026-05-12,0
BS-1002,Add wishlist sharing,Feature,2026-04-25,2026-05-04,2026-05-04,2026-05-15,2026-05-21,2026-05-22,2026-05-26,7
BS-1003,Fix duplicate order e-mail,Bug,2026-03-11,2026-05-04,2026-05-04,2026-05-04,2026-05-05,2026-05-06,2026-05-07,0
BS-1004,Fix stock count after cancelled order,Bug,2026-03-17,2026-05-04,2026-05-04,2026-05-05,2026-05-07,2026-05-08,2026-05-12,0
Each row is an item; each state column is the date it entered that state, empty if it hasn't reached that state yet. Created is the day the record was opened, BlockedDays is the number of days the item spent with the blocked label. The dataset in this post was produced by a simulation that mimics six months of the Bookstore team's board and fits the series' story: 205 items, a board without limits and work piling up in Code Review in May–June, WIP limits tightened in September. The numbers are not made up; they are the real output of code running on this data. The dataset itself, however, is not from a real team.
Code: From CSV to Metrics
We create a .NET 10 console project (dotnet new console -n FlowMetrics); there are no external packages. The first file holds the data model, the CSV reader and the percentile calculation:
namespace Bookstore.Flow;

public sealed record WorkItem(
    string Id,
    string Title,
    string Type,
    DateOnly Created,
    IReadOnlyDictionary<string, DateOnly> Entered,
    int BlockedDays)
{
    public const string StartState = "InDev";
    public const string FinishState = "Done";

    public DateOnly? Started => Entered.TryGetValue(StartState, out DateOnly d) ? d : null;
    public DateOnly? Finished => Entered.TryGetValue(FinishState, out DateOnly d) ? d : null;

    public bool IsInProgress => Started is not null && Finished is null;

    // Work that starts and finishes on the same day counts as 1 day (finish - start + 1)
    public int? CycleTimeDays => Started is { } s && Finished is { } f ? f.DayNumber - s.DayNumber + 1 : null;

    public int AgeOn(DateOnly today) => today.DayNumber - Started!.Value.DayNumber + 1;

    // Current state on the board: latest entry date, workflow order breaks ties
    public string CurrentState => Entered.OrderBy(e => e.Value).ThenBy(e => BoardCsv.States.IndexOf(e.Key)).Last().Key;
}

public static class BoardCsv
{
    public static readonly List<string> States = ["Ready", "InDev", "CodeReview", "Test", "ReadyToDeploy", "Done"];

    public static List<WorkItem> Load(string path)
    {
        string[] lines = File.ReadAllLines(path);
        string[] header = lines[0].Split(',');
        List<WorkItem> items = [];

        foreach (string line in lines.Skip(1))
        {
            string[] cells = line.Split(',');
            Dictionary<string, DateOnly> entered = [];
            foreach (string state in States)
            {
                string value = cells[Array.IndexOf(header, state)];
                if (value.Length > 0)
                    entered[state] = DateOnly.Parse(value);
            }

            items.Add(new WorkItem(
                Id: cells[Array.IndexOf(header, "Id")],
                Title: cells[Array.IndexOf(header, "Title")],
                Type: cells[Array.IndexOf(header, "Type")],
                Created: DateOnly.Parse(cells[Array.IndexOf(header, "Created")]),
                Entered: entered,
                BlockedDays: int.Parse(cells[Array.IndexOf(header, "BlockedDays")])));
        }

        return items;
    }
}

public static class Stats
{
    // Nearest-rank percentile: the ceil(p * n)-th element of the sorted list
    public static int Percentile(IReadOnlyList<int> sorted, double p) =>
        sorted[(int)Math.Ceiling(p / 100 * sorted.Count) - 1];
}
There are a few design decisions here. The started and finished points live in the StartState and FinishState constants, so the DoW decision sits in exactly one place in the code; if the team moves the finished point, only this changes. Dates are DateOnly; we don't keep times because we talk about metrics in days. The CSV reader is deliberately simple: we know the titles contain no commas. If a real export has quoted fields, a library such as CsvHelper is safer.
For percentiles we use the nearest-rank method: in a sorted list of 193 values, the 85th percentile is the ceil(0.85 × 193) = 165th element. This method doesn't interpolate and always returns a value that actually exists in the list; it lets you say directly "85% of items finished in 15 days or less." Excel's PERCENTILE.INC function interpolates and can give slightly different results; it is enough to state which one you use.
The program answers four questions in order:
using System.Globalization;
using Bookstore.Flow;

CultureInfo.CurrentCulture = CultureInfo.InvariantCulture;

DateOnly today = new(2026, 10, 30);
List<WorkItem> items = BoardCsv.Load("board-history.csv");

// 1) Cycle time: finished items only
PrintCycleTimes("All finished (May-Oct)", items.Where(i => i.Finished is not null));
PrintCycleTimes("Finished in last 8 weeks", items.Where(i => i.Finished >= today.AddDays(-55)));

// 2) Throughput: items finished per week (empty weeks must show up as 0)
Console.WriteLine();
Console.WriteLine("Weekly throughput (last 8 weeks, Mon-Sun):");
DateOnly monday = today.AddDays(-(((int)today.DayOfWeek + 6) % 7));
for (int w = 7; w >= 0; w--)
{
    DateOnly from = monday.AddDays(-7 * w);
    int count = items.Count(i => i.Finished >= from && i.Finished < from.AddDays(7));
    Console.WriteLine($"  {from:yyyy-MM-dd}  {count,2} {new string('#', count)}");
}

// 3) WIP and Work Item Age: work on the board today, oldest first
List<int> recent = [.. items.Where(i => i.Finished >= today.AddDays(-55)).Select(i => i.CycleTimeDays!.Value).Order()];
int p50 = Stats.Percentile(recent, 50), p85 = Stats.Percentile(recent, 85);
List<WorkItem> wip = [.. items.Where(i => i.IsInProgress).OrderByDescending(i => i.AgeOn(today))];

Console.WriteLine();
Console.WriteLine($"WIP on {today:yyyy-MM-dd}: {wip.Count} items (p50 = {p50} d, p85 = {p85} d)");
foreach (WorkItem i in wip)
{
    int age = i.AgeOn(today);
    string flag = age > p85 ? "  <-- older than p85" : age > p50 ? "  <-- older than p50" : "";
    Console.WriteLine($"  {i.Id}  {i.CurrentState,-13} age {age,2} d  {i.Title}{flag}");
}

// 4) Pitfall: using Created as the start
List<int> fromCreated = [.. items.Where(i => i.Finished >= today.AddDays(-55))
    .Select(i => i.Finished!.Value.DayNumber - i.Created.DayNumber + 1).Order()];
Console.WriteLine();
Console.WriteLine($"Same items measured from Created: p50 = {Stats.Percentile(fromCreated, 50)} d, p85 = {Stats.Percentile(fromCreated, 85)} d");

static void PrintCycleTimes(string label, IEnumerable<WorkItem> finished)
{
    List<int> ct = [.. finished.Select(i => i.CycleTimeDays!.Value).Order()];
    Console.WriteLine($"{label}: n = {ct.Count}, mean = {ct.Average():F1} d, " +
        $"p50 = {Stats.Percentile(ct, 50)} d, p85 = {Stats.Percentile(ct, 85)} d, " +
        $"p95 = {Stats.Percentile(ct, 95)} d, max = {ct[^1]} d");
}
Instead of grouping weeks with LINQ (Language Integrated Query), the throughput loop walks through eight weeks starting on Monday one by one. The reason is simple: GroupBy never produces a week in which no item finished, yet a week with zero throughput is one of the most important facts. The real output:
All finished (May-Oct): n = 193, mean = 11.4 d, p50 = 10 d, p85 = 15 d, p95 = 21 d, max = 24 d
Finished in last 8 weeks: n = 66, mean = 10.1 d, p50 = 9 d, p85 = 14 d, p95 = 18 d, max = 24 d

Weekly throughput (last 8 weeks, Mon-Sun):
  2026-09-07  11 ###########
  2026-09-14   5 #####
  2026-09-21  10 ##########
  2026-09-28   9 #########
  2026-10-05   6 ######
  2026-10-12   8 ########
  2026-10-19  10 ##########
  2026-10-26   7 #######

WIP on 2026-10-30: 11 items (p50 = 9 d, p85 = 14 d)
  BS-1205  InDev         age 19 d  Add 3-D Secure fallback for card payments  <-- older than p85
  BS-1193  ReadyToDeploy age  8 d  Add customer reviews moderation
  BS-1194  ReadyToDeploy age  8 d  Fix VAT rounding on invoice PDF
  BS-1196  Test          age  5 d  Fix duplicate order e-mail
  BS-1197  ReadyToDeploy age  5 d  Fix stock count after cancelled order
  BS-1198  InDev         age  4 d  Add gift card balance page
  BS-1199  CodeReview    age  3 d  Fix cart total when coupon expires
  BS-1200  CodeReview    age  2 d  Change delivery address for order BK-2026-006660
  BS-1204  Test          age  2 d  Urgent: refund request for order BK-2026-004401
  BS-1201  CodeReview    age  1 d  Export sales report for publisher
  BS-1202  InDev         age  1 d  Fix author search with apostrophes

Same items measured from Created: p50 = 46 d, p85 = 79 d
Reading the Output: Why Percentiles, Not the Average
Back to the opening question. Over the whole period the average is 11.4 days, but the median (p50) is 10 days, p85 is 15 days, p95 is 21 days and the longest item took 24 days. The average is above the median because the distribution has a long right tail: most work finishes in 7–12 days, but the occasional big feature or blocked item that passes 20 days pulls the average up. Cycle time distributions are almost always right-skewed like this, because work can't take much less than a few days but can take a very long time.
If the product owner tells a customer "11 days on average," roughly 40% of the items in this data break that promise. "Average" sounds safe but really means "roughly a coin toss." A percentile states a probability directly: "85% of items finished within 15 days." An SLE (Service Level Expectation) is exactly that sentence, and in post 05 we will turn it into a forecast.
Looking at the last 8 weeks, the numbers improve: p50 is 9 days, p85 is 14 days. That is the effect of the September WIP change; but careful, this window also contains work that started before September. To measure the change cleanly you need to split by start date; we will do that in post 06.
Weekly throughput moves between 5 and 11. Part of that comes from deploy days: because the team deploys only on Tuesdays and Thursdays, items enter Done in batches. Weekly throughput swinging this much is normal, and it shows why saying "we slowed down" from a single week is wrong. The average is 8.3 items a week; but when forecasting we will use the distribution itself, not the average.
The Cycle Time Scatterplot
The most useful way to visualize the same data is the cycle time scatterplot: the day an item finished on the x axis, its cycle time on the y axis, percentiles as horizontal lines.
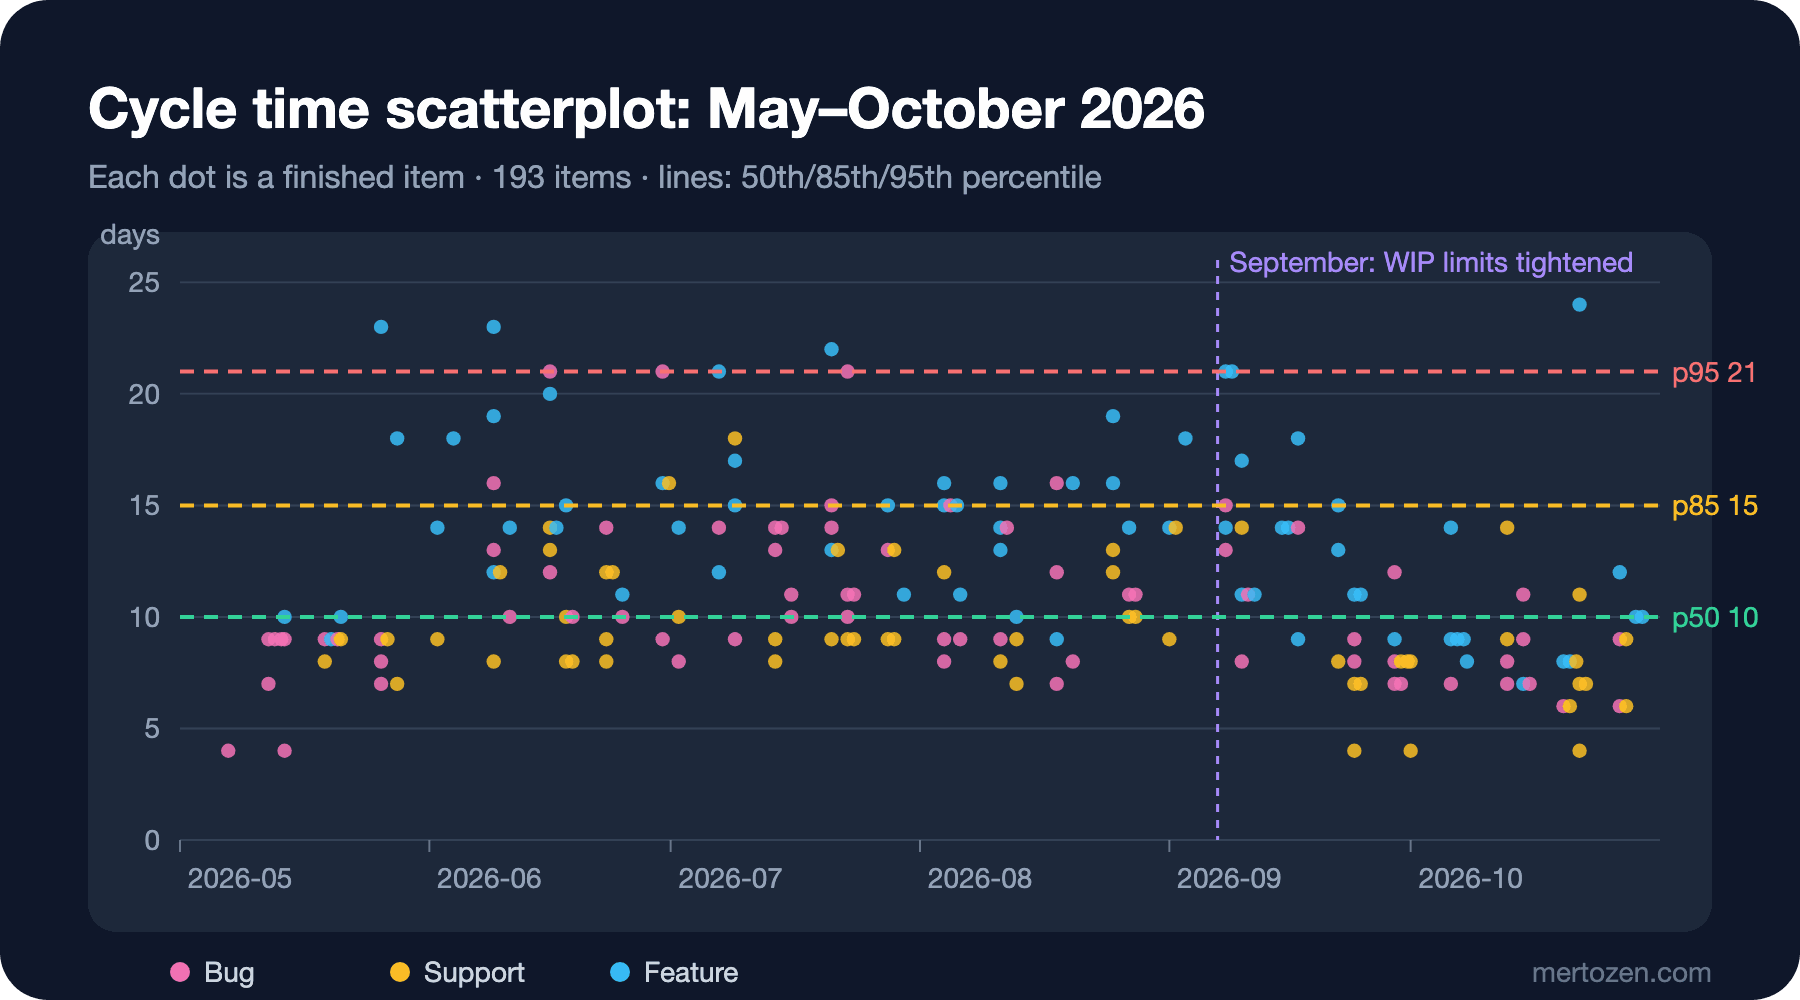
Three things can be read from this chart. First, density: most dots sit between the p50 and p85 lines, so "typical" work takes 10–15 days. Second, trend: between June and August the dots spread upward, and after the purple line in September they come down and tighten; the effect of the WIP limits is visible without looking at a table. Third, outliers: every dot above the p95 line is a story. Take the 24-day feature in October; the team will want to talk about it in the retro.
The colors show the item type, and you can see that support work (yellow) usually stays near the bottom while big features (blue) fill the top. That suggests computing separate percentiles per type could be useful; but don't split the numbers before you are sure each type has enough data. Below 30 items percentiles get jumpy.
Work Item Age and the Aging Chart
Cycle time only sees finished work. BS-1205, which has sat in In Dev for 19 days, is not on the scatterplot because it hasn't finished; when it does finish, it will already be late. That is why Work Item Age gives the earliest warning of the four metrics: it shows that an item will be late on the day it starts falling behind, not after it is late.
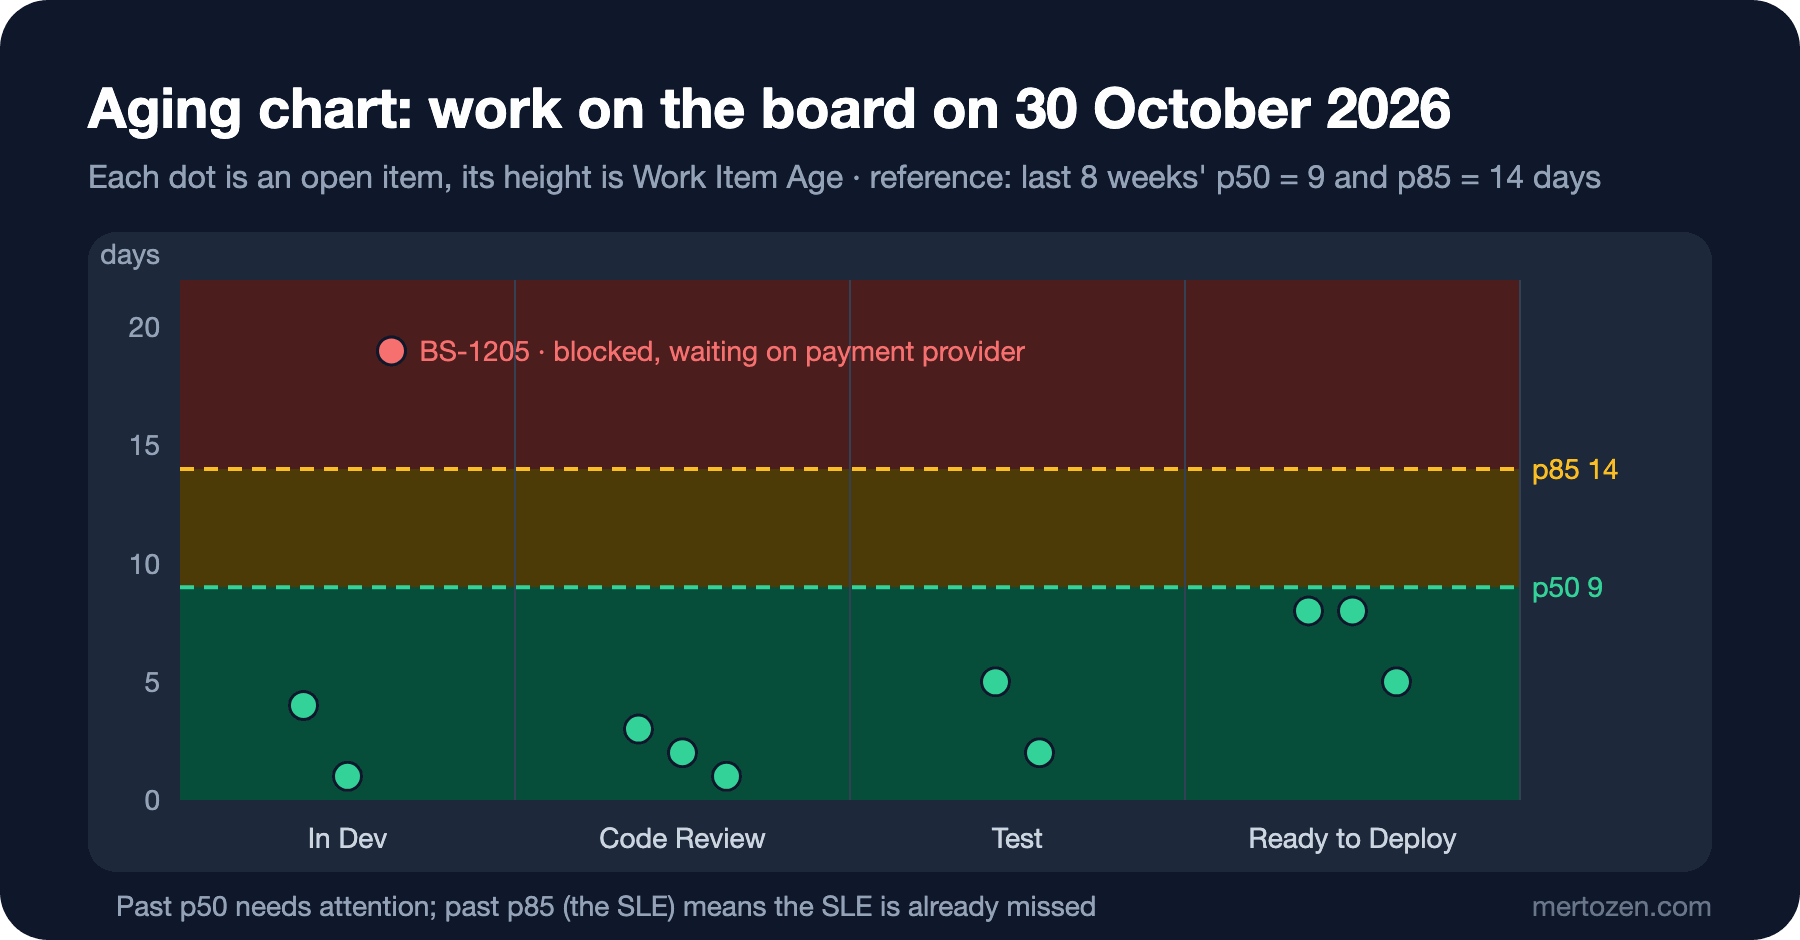
In the aging chart the x axis is the board's columns, each dot is an open item and its height is its age. The background bands come from the last 8 weeks' percentiles: the green zone is below p50, the yellow zone between p50 and p85, the red zone above p85. The two 8-day items in Ready to Deploy are approaching p50 but are still green; they will go out with Tuesday's deploy. BS-1205, on the other hand, sits alone in the red zone: a feature for a 3-D Secure fallback that is waiting on the payment provider's test environment. It has already missed the 14-day SLE.
The real value of this chart is reading it from right to left. An old item in the columns on the right is close to done; a small push gets it out. An old item in the columns on the left is both old and still has a long way to go. At the Daily, the team's first question should not be "what did you do yesterday?" but "how do we move our oldest item forward today?"; we will open that up in post 06.
A Quick Look at the Cumulative Flow Diagram
There is one more tool that shows three of the four metrics in a single chart: the CFD (Cumulative Flow Diagram). For each day, the total number of items that have entered each state up to that day is plotted, which produces stacked bands. The vertical distance between two lines is the number of items in that state that day, which is that column's WIP. The slope of the bottom line shows throughput. The horizontal distance between bands gives an approximate waiting time.
A CFD is most useful for seeing a band widen over time: if work enters a state faster than it leaves, that band thickens and a bottleneck is forming there. Bookstore's Code Review band widened exactly like that between June and August. We will compute the CFD from the same data and examine that band in post 06.
In Production
Pick the window deliberately. Using the whole history means more data, but old data misleads if the system has changed. At Bookstore the WIP limits changed in September; May's data doesn't describe today's system. Working with the last 6–12 weeks and at least 30 finished items is generally a good start; if the system changed significantly, start the window at that date.
Decide up front between calendar days and working days. We used calendar days, because customers wait by the calendar and weekends are waiting time too. If you want working days, do the calculation the same way everywhere; don't feed Little's Law or Monte Carlo mixed units.
Automate the calculation. Turning this console app into a scheduled job that downloads the export and runs every Monday is an hour's work; posting the result to the team channel turns metrics from "something we look at once in the retro" into something people see. Having the calculation in code also keeps the answer to "where did this number come from?" always at hand.
Common Pitfalls
The most expensive pitfall is taking the start date from the Created field instead of from a state change. The last line of the program does exactly that for the same 66 items: p50 goes from 9 to 46 days and p85 from 14 to 79 days. Created is the day the record entered the backlog; the weeks in between measure the size of the backlog, not the team's flow. The time from Created to Done is a useful number too (request to resolution, from the customer's point of view), but reporting it as cycle time is wrong; give it its own name.
The second pitfall is losing zero weeks. If you compute throughput with GroupBy, a week in which nothing finished never shows up in the list and average throughput comes out higher than it is. In a forecast this error turns straight into an optimistic date.
The third is looking only at finished work. By definition, the cycle time calculation leaves out unfinished work. If the board has five items that started three months ago and were forgotten, your cycle time looks great; until those items finish. Don't trust cycle time without looking at Work Item Age.
The fourth is tying a metric to a person. Computing "Ahmet's cycle time" is technically possible but goes against the point of Kanban: flow is a property of the system, and the moment it is tied to a person, people split work to improve the number and avoid hard work. Metrics measure the board, not the person.
A Small Experiment
★☆☆ Add separate cycle time percentiles per item type (Bug, Support, Feature) to the program. Which type's p85 stays above the SLE? How many items does each type have, and is it enough for percentiles?
★★☆ Compute throughput per day instead of per week and find the share of zero days. Can you see the effect of the Tuesday and Thursday deploys? How would this distribution change if the team deployed every day?
★★★ Produce a file in this CSV format from your own team's Jira or GitHub Projects data (by pulling state transition dates from the changelog) and run the program on it. Check Little's Law: how close is average WIP / daily throughput to the average cycle time you measured?
We have learned to measure the past. In the next post we turn that past into the future: we will derive an SLE from the same data and, with a 10,000-run Monte Carlo simulation, answer "how many items will be done by 27 November?" and "when will the gift card epic be done?" with probabilities.