

Distributed Tracing and Observability: Following One Order from Angular to RabbitMQ
To see one order end to end in a single trace, ServiceDefaults needs Wolverine's ActivitySource and the gRPC client instrumentation; the trace context travels in the message's parent-id header. A trace that ended after two services grew to 81 spans across five; most of checkout's 1.15 seconds is the payment provider, the trace breaks at reconciliation, and order and payment metrics are measured with IMeterFactory.
Version note: The code in this post was built and run with .NET 10, Aspire 13.6, OpenTelemetry .NET 1.21 (OpenTelemetry.Instrumentation.GrpcNetClient 1.21.0-beta.1), WolverineFx 6.64 and dotnet-counters 10.0; the example in the .NET 11 note was run with the .NET 11 SDK (11.0.100).
Guess First
Since post 02 every service has been wired to OpenTelemetry through ServiceDefaults, and the Aspire dashboard has a "Traces" page. In post 11 Ada's order for Emma went through the BFF, Ordering, RabbitMQ, Inventory, Payments and Notifications. When you open that order's POST /api/orders trace in the dashboard, how many services do you see? Second question: the payment result comes from the external payment provider as a webhook. Does the webhook's span end up in the order's trace, or does it start a separate trace? The answers come from Aspire's telemetry export.
The Lines Missing from ServiceDefaults
The answer to the first question, as we left things in post 11: two services. The Aspire CLI's aspire export command writes the dashboard's traces into a zip as OTLP JSON; with a small script that builds the tree from parent span ids, that order of Bookstore, the online bookstore used as the shared example across this site's series, looked like this (columns: start in ms, duration in ms):
     0.0    111.4  [bff] POST /api/orders 202
     0.3    110.9    [bff] POST 202
     0.6    109.7      [ordering] POST /api/v{version:apiVersion}/orders/ 202
     2.4     20.7        [ordering] SELECT [CatalogBooks]
    27.7      7.4        [ordering] insert wolverine_outgoing_envelopes
    35.2      8.3        [ordering] insert wolverine.wolverine_incoming_envelopes
    47.3      2.0        [ordering] orderingdb
    49.4     52.2        [ordering] INSERT
   104.7      2.8        [ordering] delete
   108.1      1.7        [ordering] SELECT [o].[Status] [OrderItems]
10 spans; scopes: ['Microsoft.AspNetCore', 'OpenTelemetry.Instrumentation.SqlClient', 'System.Net.Http']
The trace ends with the row written to the outbox table. Saga, stock, payment, notification: none of them are there. HTTP and SQL spans are there because ServiceDefaults turns on the ASP.NET Core and HttpClient instrumentation, and Aspire's Aspire.Microsoft.EntityFrameworkCore.SqlServer component adds OpenTelemetry.Instrumentation.SqlClient by itself. Aspire.StackExchange.Redis does the same for Redis. What is missing is the messaging side: Wolverine produces its spans from an ActivitySource named Wolverine, and nobody was listening to it. For gRPC there is the instrumentation the template left in a commented-out line. What we added to ServiceDefaults:
.WithMetrics(metrics =>
{
    metrics.AddAspNetCoreInstrumentation()
        .AddHttpClientInstrumentation()
        .AddRuntimeInstrumentation()
        // Wolverine's meter is named "Wolverine:<application name>", so it needs the wildcard
        .AddMeter("Wolverine*")
        // Business metrics: every service names its Meter "Bookstore.<Service>" (post 12)
        .AddMeter("Bookstore.*");
})
.WithTracing(tracing =>
{
    tracing.AddSource(builder.Environment.ApplicationName)
        .AddAspNetCoreInstrumentation(tracing =>
            // Exclude health check requests from tracing
            tracing.Filter = context =>
                !context.Request.Path.StartsWithSegments(HealthEndpointPath)
                && !context.Request.Path.StartsWithSegments(AlivenessEndpointPath)
        )
        // rpc.* attributes (service, method, status code) on the BFF's calls to Inventory
        .AddGrpcClientInstrumentation()
        .AddHttpClientInstrumentation()
        // Wolverine's spans: sending a message, receiving it, running the handler. The trace context
        // travels in the message's headers, so a handler in another service continues the same trace.
        .AddSource("Wolverine");
});
OpenTelemetry.Instrumentation.GrpcNetClient only has a beta version on NuGet (1.21.0-beta.1); we noted that with a comment in Directory.Packages.props. Because Wolverine's meter name includes the application name, AddMeter("Wolverine") catches nothing; Wolverine's documentation says to use the wildcard as well. The full OpenTelemetry setup and the backend side are in the Observability series; here we only look at what was missing in Bookstore.
The Trace Context Inside the Message
Over HTTP the trace context travels in the traceparent header, and HttpClient and ASP.NET Core do that on their own. In messaging the library has to do it. We took an OrderPlaced that Wolverine sent to RabbitMQ from a queue we bound for the test and looked at its properties:
type:            Bookstore.Contracts.Ordering.OrderPlaced
correlation_id:  84804c281ad12445895ace55edc19889
parent-id:       00-84804c281ad12445895ace55edc19889-a81bf76074da83ef-03
The parent-id header carries the sending span in W3C Trace Context format (00-<trace id>-<span id>-<flags>); Wolverine's consumer side opens a new child span from that value. The AMQP message's correlation_id is the trace id itself. The header's name is not traceparent; it is specific to Wolverine. A consumer that does not use Wolverine (a service written in another language, for example) has to know that name to join the trace.
The spans' attributes are not exactly OpenTelemetry's messaging semantic conventions either. Wolverine writes messaging.system, messaging.destination and messaging.message_id; the current conventions say messaging.system.name, messaging.destination.name and messaging.message.id. This part of the conventions is still in "Development" status, and the specification asks existing instrumentations not to change their default output until it becomes stable. There is one more difference: by default the specification recommends span links between producer and consumer; Wolverine makes the consumer span a direct child of the producer. For single-message flows that lets you see a whole checkout as one tree; a consumer that processes batches could not make do with a single parent.
Reading the Checkout Trace
After the change the same flow (system warm, second order) has 81 spans and five services. With the SQL spans hidden, in short:
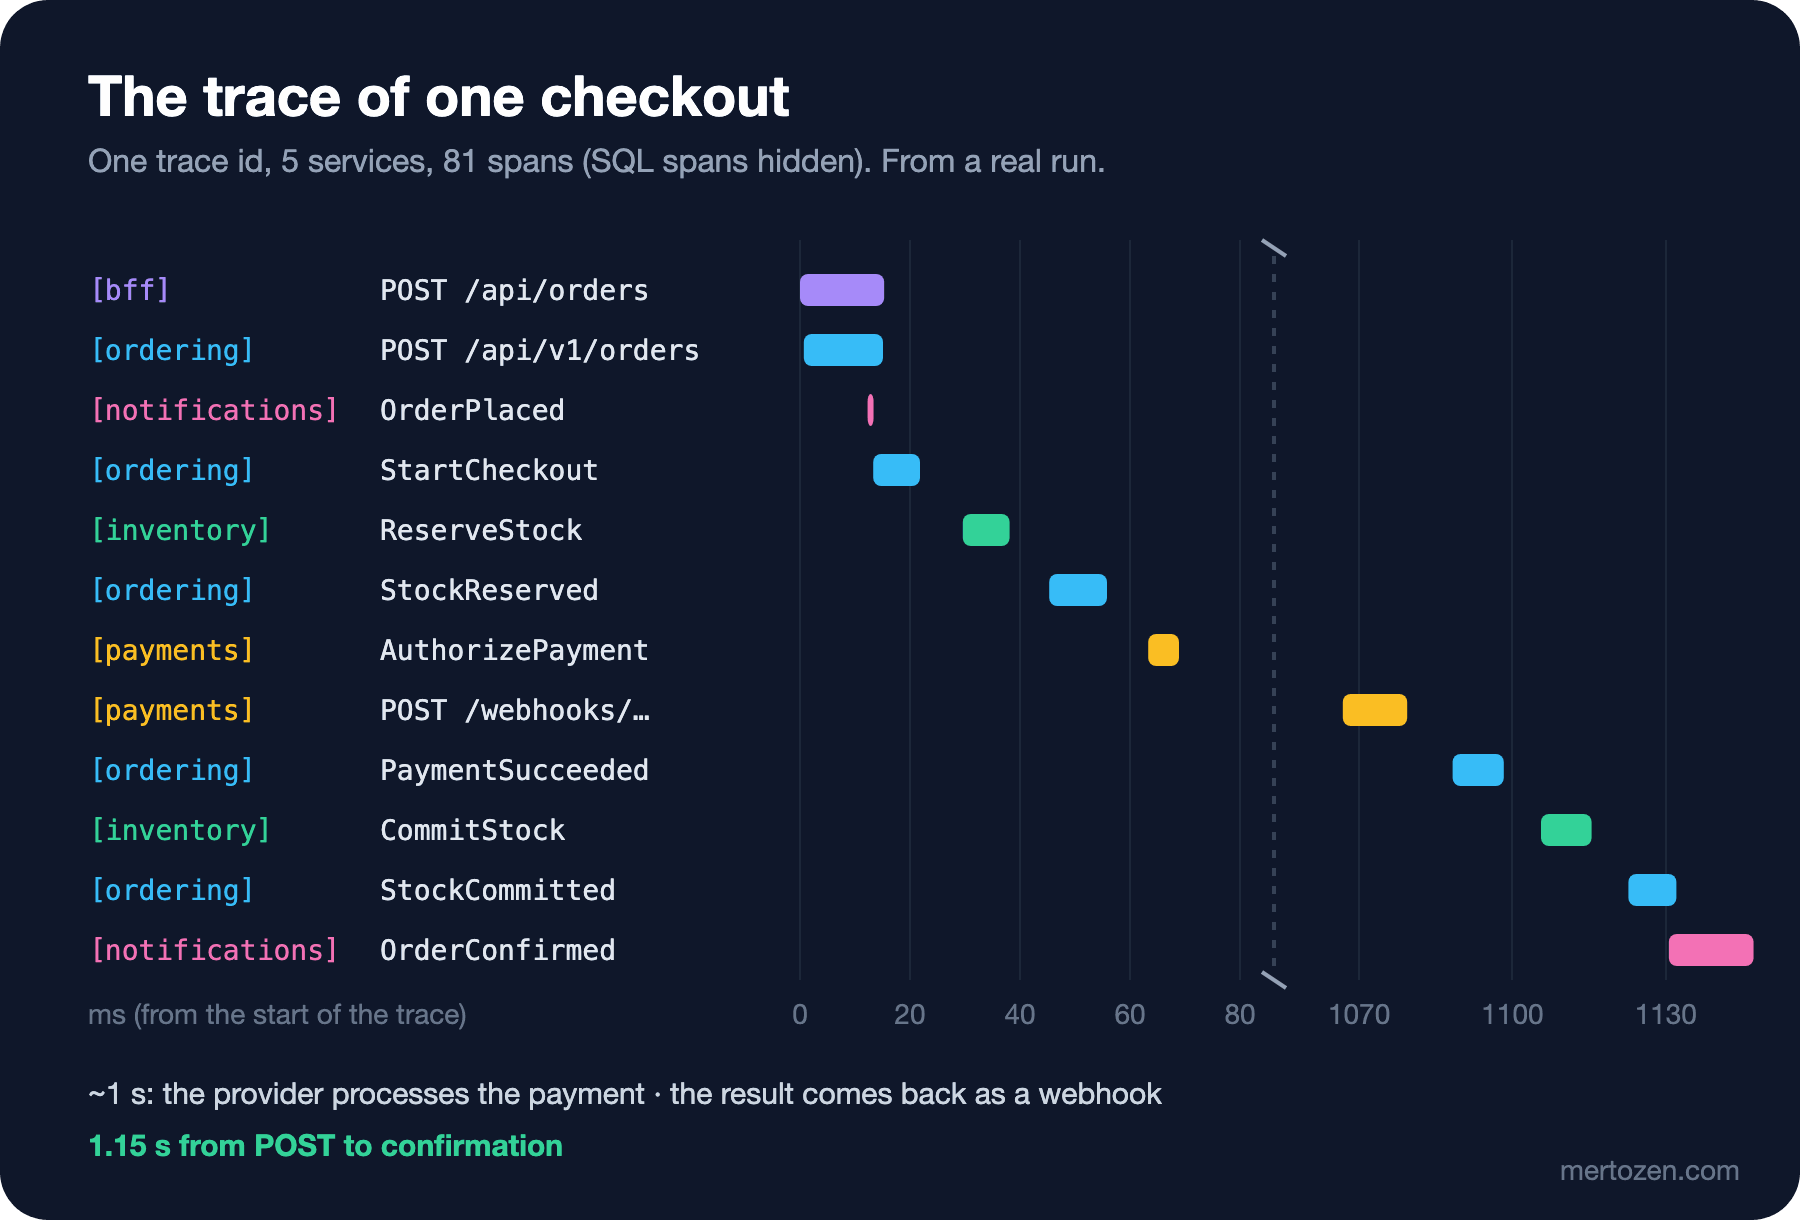
     0.0     15.3  [bff] POST /api/orders 202
     0.7     14.4      [ordering] POST /api/v{version:apiVersion}/orders/ 202
    11.4      1.9        [ordering] send
    12.3      0.2        [notifications] receive
    13.3      8.5        [ordering] Bookstore.Ordering.Checkout.StartCheckout
    29.6      8.5          [inventory] Bookstore.Contracts.Inventory.ReserveStock
    45.3     10.5            [ordering] Bookstore.Contracts.Inventory.StockReserved
    63.3      5.6              [payments] Bookstore.Contracts.Payments.AuthorizePayment
    64.7      0.9                [payments] POST 202
  1066.8     12.6  [payments] POST /webhooks/payment-provider 200
  1088.3     10.0    [ordering] Bookstore.Contracts.Payments.PaymentSucceeded
  1105.6      9.9      [inventory] Bookstore.Contracts.Inventory.CommitStock
  1122.7      9.4        [ordering] Bookstore.Contracts.Inventory.StockCommitted
  1130.6     16.6          [notifications] receive
A few things can be read off right away. The part the user waits for (the BFF's span) is 15 ms; the rest happens in the background. Each hop through RabbitMQ, between one handler's send and the start of the handler in the other service, takes 8–10 ms. The one-second gap is not our code: the payment provider accepts the charge and sends the result about a second later as a webhook. The answer to "why does checkout take 1.15 seconds?" is visible at a glance: the provider.
The answer to the second question: the webhook is in the same trace. The fake payment provider has no OpenTelemetry, but the ASP.NET Core inside it creates an Activity from the incoming traceparent, and the HttpClient that sends the webhook writes the same context back into a header. The webhook span's parent is in the provider; since that span never reaches the dashboard, it sits in the tree like a root, but the trace id is the same. A real payment provider will not carry our trace context into its webhook; there the trace breaks at this point and the two traces have to be matched by order id.
On the gRPC side we saw something new too. In the book page's trace the BFF's GetStock span takes 34 ms; inside it is a 29 ms POST .../protocol/openid-connect/token span to Keycloak, and Inventory itself takes 3 ms:
bff Client bookstore.inventory.v1.InventoryService/GetStock 34 {'rpc.system.name': 'grpc', 'rpc.method': 'bookstore.inventory.v1.InventoryService/GetStock', 'server.address': '_grpc.inventory', 'rpc.response.status_code': 'OK'}
bff Client POST 29 {'url.full': 'http://localhost:8180/realms/bookstore/protocol/openid-connect/token', 'http.response.status_code': '200 OK'}
inventory Server POST /bookstore.inventory.v1.InventoryService/GetStock 3 {'grpc.method': '/bookstore.inventory.v1.InventoryService/GetStock', 'grpc.status_code': '0'}
The call credentials we added in post 10 fetch the token inside the gRPC call, so the 500 ms deadline from post 09 also covers fetching the token. That is exactly why the first book page got DeadlineExceeded right after the system started in post 11: the first token from a cold Keycloak, the first HTTP/2 connection and Inventory's first request did not fit into the same 500 ms. The logs did not show that split; in the trace it is one line.
When the Trace Breaks: Reconciliation
The reconciliation job from post 08 asks the provider about payments whose webhook never arrived. We dropped the webhooks in the fake provider and placed an order. The order's trace ended at AuthorizePayment, with 44 spans. The rest became a separate trace:
     0.0     14.7  [ordering] Bookstore.Contracts.Payments.PaymentSucceeded
    29.2     19.7    [inventory] Bookstore.Contracts.Inventory.CommitStock
    60.2     11.2      [ordering] Bookstore.Contracts.Inventory.StockCommitted
    71.1     31.6        [notifications] receive
29 spans; scopes: ['OpenTelemetry.Instrumentation.SqlClient', 'OpenTelemetry.Instrumentation.StackExchangeRedis', 'Wolverine']
The OrderConfirmed message of this trace carried a different trace id in parent-id (077f2fd4…), and its correlation_id was no longer a trace id but a random GUID. The job starts from a timer, not from an HTTP request or a message; it has no trace context for the order. Every piece of work that continues from a database row (reconciliation, a scheduled job, another process draining the outbox) has this problem. The fix is to store the context with the row: write the first request's traceparent into the Payment record and add it as a link to the span the job opens. That is one of the reasons the specification recommends links.
Logs and Business Metrics
ServiceDefaults sends logs through OpenTelemetry too, and every log record carries the current trace id. We pulled one checkout's logs by trace id with the Aspire CLI: aspire otel logs --trace-id 37987620… returned 34 records from five services; without EF Core's SQL logs, what remains:
[notifications] Order 01a1dacd-36e8-7ba3-96ad-e5fac7c385b8 placed by f7afeb42-184d-43b6-b035-e9bdb6100d33: 249.90 TRY, 1 line(s)
[inventory]     Reserved 1 line(s) for order 01a1dacd-36e8-7ba3-96ad-e5fac7c385b8 until 2026-11-14T16:24:04.6929290Z
[payments]      Webhook evt_3d41445029c9479385ff175c0a004ca2: payment for order 01a1dacd-36e8-7ba3-96ad-e5fac7c385b8 is Succeeded
[inventory]     Reservation 01a1dacd-37d4-796b-831e-a6d14a3636fd for order 01a1dacd-36e8-7ba3-96ad-e5fac7c385b8 Committed
[notifications] E-mail confirmed for order 01a1dacd-36e8-7ba3-96ad-e5fac7c385b8 sent to ada@example.com
One query instead of grepping five processes' logs for the order id. This is the microservice counterpart of the setup in the "Correlation ID ve Trace Context" post of the Logging series; in production the same query runs by trace id in the log backend.
A trace tells the story of one order; "how many orders per minute, how long does checkout take, what share of payments is declined" are questions for metrics. We added a Meter to Ordering through IMeterFactory:
// Business metrics: how many orders come in, how long checkout takes and how it ends.
// Tags stay low-cardinality: an outcome and a reason category, never an order id or an ISBN.
public sealed class CheckoutMetrics
{
    public const string MeterName = "Bookstore.Ordering";

    private readonly Counter<long> ordersPlaced;
    private readonly Histogram<double> checkoutDuration;

    public CheckoutMetrics(IMeterFactory meterFactory)
    {
        Meter meter = meterFactory.Create(MeterName);
        ordersPlaced = meter.CreateCounter<long>("bookstore.orders.placed", unit: "{order}",
            description: "Orders accepted by Ordering (202), before stock and payment are known.");
        checkoutDuration = meter.CreateHistogram<double>("bookstore.checkout.duration", unit: "s",
            description: "From the order being placed to the saga's end: confirmed or cancelled.",
            advice: new InstrumentAdvice<double> { HistogramBucketBoundaries = [0.1, 0.25, 0.5, 1, 2.5, 5, 10, 30, 60, 300, 900] });
    }
When the saga confirms or cancels, it records the duration as clock.GetUtcNow() - order.PlacedAtUtc; the tags are bookstore.checkout.outcome (confirmed, cancelled) and bookstore.checkout.reason (none, out-of-stock, payment-failed, payment-timeout). We set the histogram's bucket boundaries ourselves, because the default boundaries are meant for HTTP durations in milliseconds; our checkout can take up to 15 minutes. In Payments the bookstore.payments.completed counter records the outcome and where it came from (answer, webhook, reconciliation). In the first attempt we put the counter on the provider's answer to the charge, and every payment was counted as pending; the result arrives by webhook, so that is where the counter belongs. We read the values from the live processes with dotnet-counters, during the browser scenarios from post 11 and an order whose webhooks were dropped:
bookstore.orders.placed ({order} / 5 sec)[bookstore.currency=TRY]                                                   3
bookstore.checkout.duration (s)[outcome=cancelled;reason=out-of-stock;Percentile=50]                         0.0519
bookstore.checkout.duration (s)[outcome=cancelled;reason=payment-failed;Percentile=50]                       1.1289
bookstore.checkout.duration (s)[outcome=confirmed;reason=none;Percentile=50]                                 1.9355
bookstore.payments.completed ({payment} / 5 sec)[outcome=succeeded;result_source=webhook]                         2
bookstore.payments.completed ({payment} / 5 sec)[outcome=failed;result_source=webhook]                            1
bookstore.payments.completed ({payment} / 5 sec)[outcome=succeeded;result_source=reconciliation]                  1
bookstore.checkout.duration (s)[outcome=confirmed;reason=none;Percentile=50]                                14.4844
The last two lines tell the same story from two sides: the webhook did not arrive, reconciliation found the result, and that order's checkout took 14.5 seconds. If the share of result_source=reconciliation grows, webhooks are getting lost on the way; you would not notice that by looking at traces one by one. To keep the lines readable we shortened the bookstore.checkout. and bookstore.payment. prefixes of the tag names.
A .NET 11 Note: ASP.NET Core's Own Span Attributes
With .NET 11, ASP.NET Core adds OpenTelemetry's HTTP semantic convention attributes to the HTTP server span of the Microsoft.AspNetCore activity source by itself; in .NET 10 the OpenTelemetry.Instrumentation.AspNetCore package does that job. We ran the same small application without any OpenTelemetry package, with only an ActivityListener, on the .NET 10 and .NET 11 SDKs:
10.0.13 Microsoft.AspNetCore.Hosting.HttpRequestIn "Microsoft.AspNetCore.Hosting.HttpRequestIn":
11.0.0 Microsoft.AspNetCore.Hosting.HttpRequestIn "GET /api/v1/books/{isbn}": client.address=127.0.0.1, network.peer.address=127.0.0.1, network.peer.port=51690, server.address=127.0.0.1, server.port=51689, http.request.method=GET, url.scheme=http, url.path=/api/v1/books/9780141439587, http.response.status_code=200, network.protocol.version=1.1, http.route=/api/v1/books/{isbn}
On .NET 10 the span's name and attributes are empty; on .NET 11 the name comes from the route template and the attributes are filled in. When you upgrade Bookstore to .NET 11, AddSource("Microsoft.AspNetCore") may be enough in place of AddAspNetCoreInstrumentation() in ServiceDefaults. Before removing the package, check what else you get from it: our ServiceDefaults keeps health check requests out of tracing with Filter, and that option comes from the package. If you don't want the attributes, Microsoft Learn's "What's new in ASP.NET Core 11" page gives the Microsoft.AspNetCore.Hosting.SuppressActivityOpenTelemetryData AppContext switch.
In Production
The dashboard is a local tool. The Aspire dashboard keeps telemetry in memory, and everything is gone when it restarts. In production the services send over OTLP to an OpenTelemetry Collector, the collector writes traces to Tempo, logs to Loki and metrics to Prometheus, and everything comes together in Grafana; the setup is in the Observability series. The only thing that changes in code is OTEL_EXPORTER_OTLP_ENDPOINT.
Decide on sampling. Every order has 81 spans; for 800 orders a day that is no problem, but at the campaign peak of 120 orders a minute the cost grows. Head sampling, deciding at the start of the trace, may also drop the failed traces; tail sampling, deciding in the collector after the trace ends, lets you keep the errors and the slow ones and thin out the rest.
Keep personal data out of spans. SqlClient spans carry the SQL text, ASP.NET Core spans carry the user's browser details (user_agent.original), and one of our logs writes an e-mail address. Decide who can access the telemetry backend and how long it is kept with that in mind.
Keep the number of possible values of metric tags small. Had we put the cancellation reason's text ("Out of stock: 9781400079988") into bookstore.checkout.reason, every ISBN would open a new time series. The reason's text goes to the log, its category to the metric.
Common Pitfalls
Forgetting to add the messaging library's ActivitySource. Once HTTP and SQL spans show up, the trace looks complete; the real work is in the messages.
Not expecting the trace to break in background jobs. Work that starts from a timer opens a new trace; unless you stored the context with the data, you can only match the two traces by a business key.
Not knowing what a deadline covers. Fetching a token, resolving DNS and opening a connection count towards the call's duration; the trace shows it, the logs don't.
Leaving a histogram with the default buckets. In a workflow that takes seconds or minutes all measurements fall into the last bucket and the percentiles stop meaning anything.
Counting a business metric in the wrong place. Like our first counter, a metric counted where the result is not known yet shows everything as "pending".
A Small Experiment
★☆☆ Open a checkout trace in the dashboard and look at the SQL spans. How many SQL commands run in one handler, and how many of them go to Wolverine's inbox/outbox tables?
★★☆ Connect the reconciliation job to the trace: store the first request's traceparent on Payment, open an Activity per payment in the job and add the stored context as an ActivityLink. Can you see the link in the dashboard?
★★★ Set Ordering's Checkout:PaymentTimeout to 5 seconds and give the fake provider a 5-second delay (POST /simulate/response-delay/5000). When PaymentSucceeded and CheckoutTimedOut arrive at the same time, find the saga's Version conflict and Wolverine's retry in the trace.
We can now see an order's path in a single trace and the health of the business in metrics. But we verified all of this with manual runs. In the next post we automate those runs: service-level tests with Testcontainers, an end-to-end checkout test that starts the whole system with Aspire.Hosting.Testing, a contract test between the BFF and Catalog with Pact, and schema tests for event contracts.