

The SEO Impact of Core Web Vitals: What Google Says, CrUX Field Data and Building Your Own RUM with web-vitals

According to Google, Core Web Vitals are used by the ranking systems but guarantee no ranking, and relevance comes first; the assessment uses field data from real users, not the Lighthouse score. We cover the thresholds and the 75th percentile, who CrUX includes, the URL groups of the Search Console report, the CrUX API in C# and an ASP.NET Core RUM endpoint that computes p75 the way Search Console does.
Version note: The code in this post was run with .NET 10 (ASP.NET Core 10), Angular 22.2 (TypeScript 6.0), web-vitals 6.2.3 and the Chromium of Playwright 1.65; no request was sent to the Chrome UX Report API. This post is based on the official documentation: Google Search Central's Core Web Vitals and page experience pages, web.dev, the Chrome UX Report docs and Search Console Help, as of 15 November 2026.
Guess First
On the blog of Bookstore, the online bookstore used as the shared example across this site's series, Ayşe tests a post with Lighthouse in the mobile profile, and the performance score comes out red. The team has two views: "With this score our rankings will drop, let's fix it now" and "The score is a lab measurement, Google does not use it". On top of that, the top part of PageSpeed Insights says there is no real-user data for this URL. Does the Lighthouse score affect rankings? If there is no real-user data, where do you learn the state of Core Web Vitals?
What Does Google Say?
Google's Core Web Vitals page on Search Central strongly recommends that site owners achieve good Core Web Vitals for success with Search, and says these metrics, together with other aspects of page experience, align with what the core ranking systems seek to reward. The FAQ on the page experience page sharpens the picture:
- There is no single page experience signal; the ranking systems look at a variety of signals that together align with page experience.
- Core Web Vitals are used by the ranking systems; other aspects of page experience do not directly help rankings, but matter for user satisfaction.
- Good Core Web Vitals results do not guarantee that a page ranks at the top; Google advises against chasing perfect scores just for SEO.
- Relevance comes first: Google tries to show the most relevant content even when its page experience is weak. Good page experience makes a difference when many helpful pages compete for the same query.
- Evaluation is generally page-specific, but Google says it has some site-wide assessments as well.
The Lighthouse score does not appear in this framework. Google mentions Lighthouse as a toolset for improving page experience; nothing says the score itself is a signal. That is the honest answer to the first opening question: a red Lighthouse score shows that there is a problem, but what affects ranking, according to Google's own docs, is Core Web Vitals themselves, and those are measured from real users.
Thresholds and the 75th Percentile
The three metrics and their "good" thresholds: LCP at most 2.5 seconds, INP at most 200 ms, CLS at most 0.1. Search Console's Core Web Vitals report gives the second boundary as well: above 4 seconds for LCP, 500 ms for INP and 0.25 for CLS is "Poor", in between is "Need improvement". INP replaced FID on 12 March 2024. Evaluation is done separately for mobile and desktop, at the 75th percentile of page loads: a page passes when three quarters of visits are at these values or better. According to web.dev, stable metrics change at most once a year, so there is no need to recheck the thresholds every month.
Field Data and Lab Data
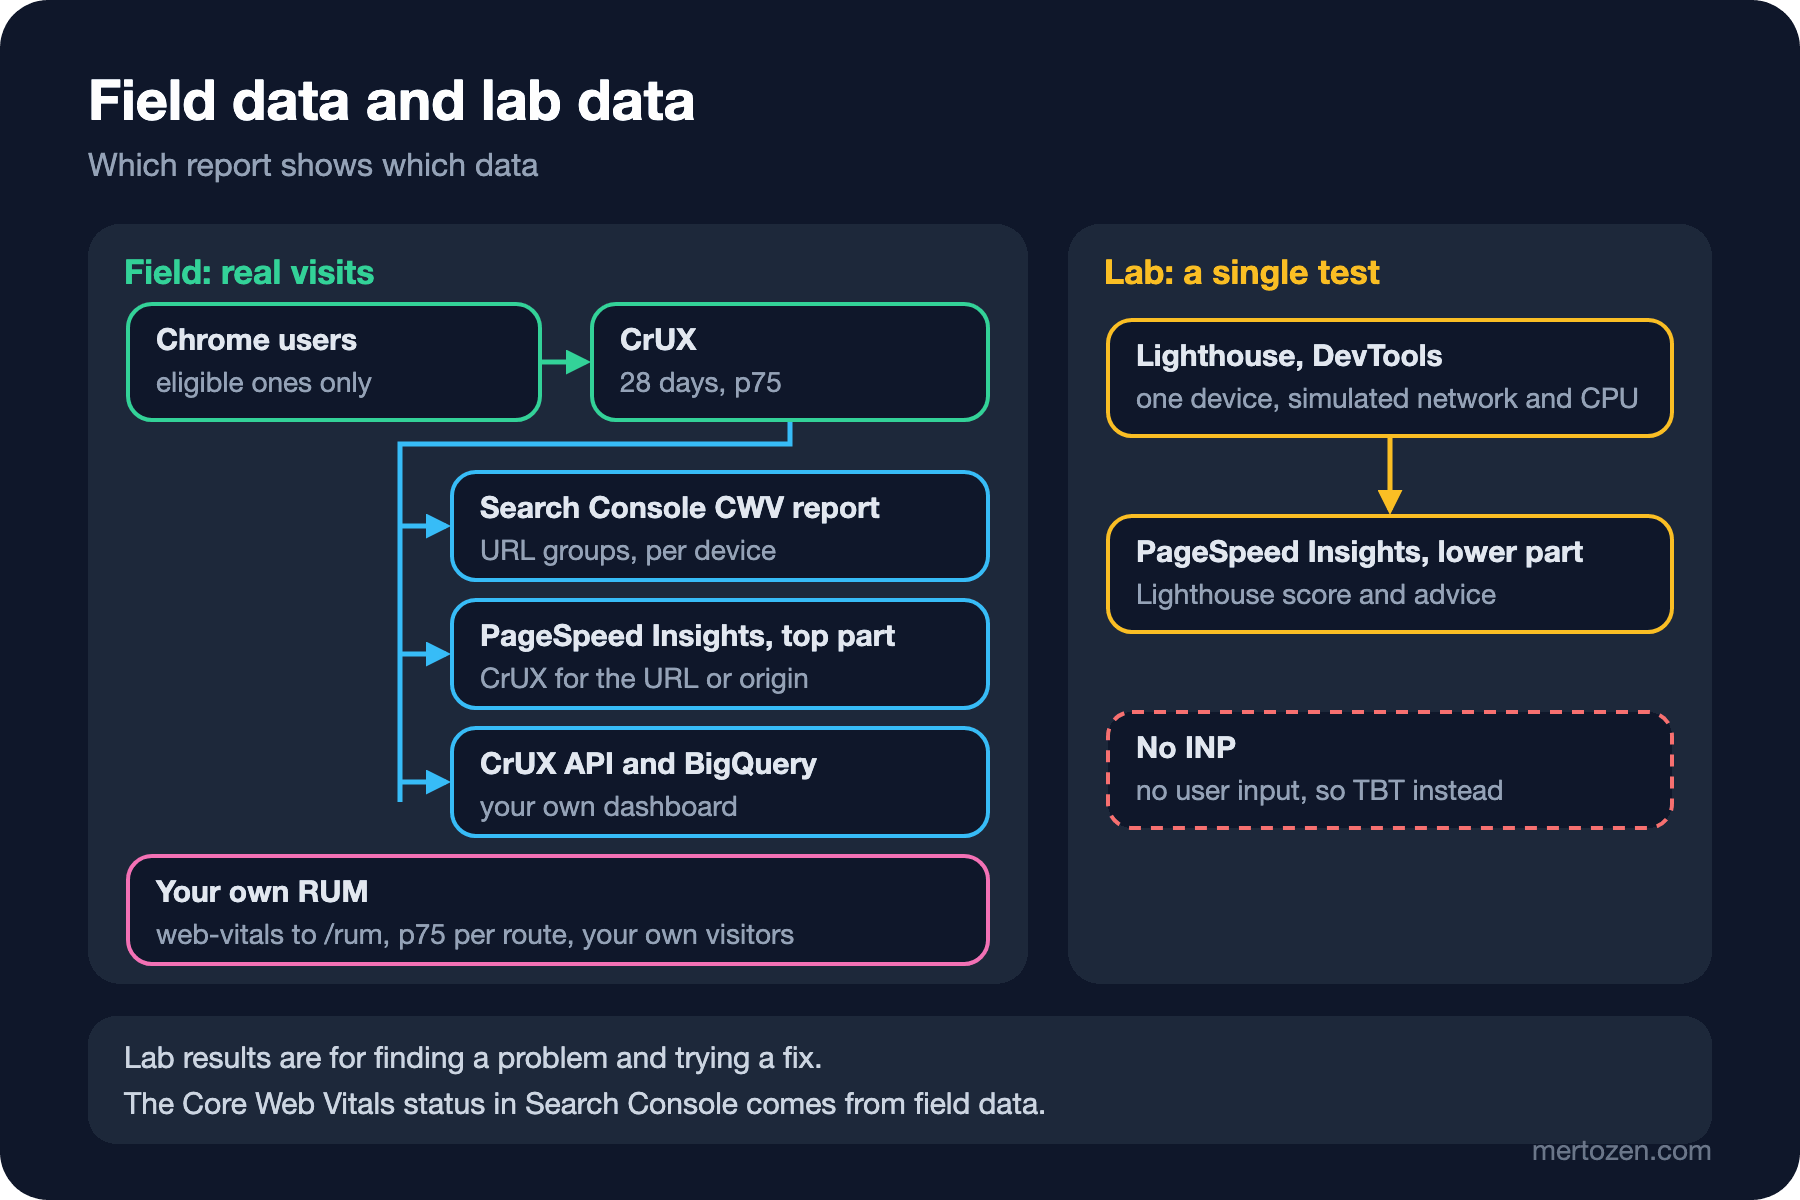
Field data comes from real visits. Google's source is CrUX. According to its methodology page, only users who turned on usage statistics reporting, sync their browsing history and have no sync passphrase are included; the platforms are desktop Chrome on Windows, macOS, ChromeOS and Linux, and Chrome on Android. Chrome on iOS, Android WebViews and other Chromium browsers such as Edge are not included. For a page or origin to enter CrUX it must be publicly discoverable, meaning it returns 200 and carries no noindex, and sufficiently popular; the threshold is not disclosed. The data is a 28-day rolling window.
Lab data is a test on a single device with a simulated network and CPU: Lighthouse and DevTools. As web.dev points out, Lighthouse has no user input, so it cannot measure INP and uses TBT instead. PageSpeed Insights shows both on one page: CrUX for the URL or origin at the top, Lighthouse below.
Search Console's Core Web Vitals report shows CrUX data in URL groups. Similar pages are grouped, and the group's status is its worst metric: a group with poor CLS and good INP is "Poor". Values are the 75th percentile, separate per device. For a group to appear it needs enough data for both LCP and CLS; if not, Search Console falls back to the origin level, and if that is not enough either, it shows nothing. To validate a fix, "Start Tracking" starts a 28-day monitoring period. The answer to the second opening question is here: a low-traffic page or a new site may have no data in CrUX; then the only field data you have is your own RUM.
Reading the CrUX API in C#
To bring CrUX into a dashboard or a weekly report there is the CrUX API: you send an origin or URL, a form factor of PHONE, DESKTOP or TABLET, and the metrics you want to the records:queryRecord endpoint. There is no OAuth, it needs an API key; the quota is 150 queries per minute per project, and the data is updated every day around 04:00 UTC. One detail to watch: the p75 of CLS comes back as a string.
using System.Globalization;
using System.Net.Http.Json;
using System.Text.Json;

namespace Bookstore.Analytics.Crux;

public sealed record CruxRecord(double? LcpP75, double? InpP75, double? ClsP75, DateOnly? From, DateOnly? To);

// Chrome UX Report API: a 28-day rolling window, needs an API key (no OAuth).
public sealed class CruxClient(HttpClient http, string apiKey)
{
    private static readonly string[] Metrics =
        ["largest_contentful_paint", "interaction_to_next_paint", "cumulative_layout_shift"];

    // formFactor: PHONE, DESKTOP or TABLET
    public async Task<CruxRecord?> QueryOriginAsync(string origin, string formFactor, CancellationToken ct = default)
    {
        using HttpResponseMessage response = await http.PostAsJsonAsync(
            $"v1/records:queryRecord?key={Uri.EscapeDataString(apiKey)}",
            new { origin, formFactor, metrics = Metrics }, ct);
        if (!response.IsSuccessStatusCode)
        {
            // e.g. an origin below the CrUX popularity threshold
            return null;
        }

        using JsonDocument json = JsonDocument.Parse(await response.Content.ReadAsStreamAsync(ct));
        JsonElement record = json.RootElement.GetProperty("record");
        JsonElement metrics = record.GetProperty("metrics");
        return new CruxRecord(
            P75(metrics, "largest_contentful_paint"),
            P75(metrics, "interaction_to_next_paint"),
            P75(metrics, "cumulative_layout_shift"),
            Date(record, "firstDate"),
            Date(record, "lastDate"));
    }

    private static double? P75(JsonElement metrics, string name)
    {
        if (!metrics.TryGetProperty(name, out JsonElement metric))
        {
            return null;
        }

        JsonElement p75 = metric.GetProperty("percentiles").GetProperty("p75");
        // CLS comes as a string ("0.05"), the others as numbers
        return p75.ValueKind == JsonValueKind.String
            ? double.Parse(p75.GetString()!, CultureInfo.InvariantCulture)
            : p75.GetDouble();
    }

    private static DateOnly? Date(JsonElement record, string name) =>
        record.TryGetProperty("collectionPeriod", out JsonElement period) && period.TryGetProperty(name, out JsonElement d)
            ? new DateOnly(d.GetProperty("year").GetInt32(), d.GetProperty("month").GetInt32(), d.GetProperty("day").GetInt32())
            : null;
}
The docs do not say which status code comes back for an origin without data, so the client treats every unsuccessful response as "no data". You give the API key to the HttpClient from configuration and never write it to logs. The tests check the parsing with JSON shaped after the documented response but with made-up numbers, and an unsuccessful response.
Your Own RUM with web-vitals
The Angular side of RUM and finding the cause of slowness were built in detail in the Web Performance post "Measuring Web Performance Correctly"; here we look at the part that matters for SEO, collecting the data the way Search Console reasons about it. The service in bookstore-web listens to the onLCP, onINP and onCLS functions of web-vitals and sends the metrics with a single sendBeacon when the page is hidden:
import { isPlatformBrowser } from '@angular/common';
import { DOCUMENT, Injectable, PLATFORM_ID, inject } from '@angular/core';
import { onCLS, onINP, onLCP, type Metric } from 'web-vitals';

interface RumBeacon {
  id: string;
  name: string;
  value: number;
  pageGroup: string;
}

// Field data from our own visitors: no cookie, no user ID, only the metric and the route pattern.
@Injectable({ providedIn: 'root' })
export class RumService {
  private readonly doc = inject(DOCUMENT);
  private readonly isBrowser = isPlatformBrowser(inject(PLATFORM_ID));
  private readonly queue = new Map<string, RumBeacon>();
  private pageGroup = 'other';
  private started = false;

  start(): void {
    if (!this.isBrowser || this.started) {
      return;
    }
    this.started = true;

    // web-vitals may report the same metric again with the same id: keep the latest value
    const report = (m: Metric) =>
      this.queue.set(m.id, { id: m.id, name: m.name, value: m.value, pageGroup: this.pageGroup });
    onLCP(report);
    onINP(report);
    onCLS(report);

    this.doc.addEventListener('visibilitychange', () => {
      if (this.doc.visibilityState === 'hidden') {
        this.flush();
      }
    });
  }

  // Like CrUX, metrics belong to the page that was loaded, not to later SPA navigations.
  landedOn(routePattern: string): void {
    if (this.pageGroup === 'other') {
      this.pageGroup = routePattern;
    }
  }

  private flush(): void {
    if (this.queue.size === 0) {
      return;
    }
    const body = new Blob([JSON.stringify([...this.queue.values()])], { type: 'application/json' });
    navigator.sendBeacon('/rum', body);
    this.queue.clear();
  }
}
Two decisions are there for consistency with Search Console. First, we send the route pattern (/blog/:slug) instead of the URL; Search Console also evaluates similar pages as a group, and single URLs never collect enough data for a p75. To find the route we used the AnalyticsTitleStrategy from the earlier posts. Second, metrics belong to the page that was loaded, not to later SPA navigations; CrUX's main metrics measure hard navigations too. web-vitals' reportSoftNavs option measures soft navigations on Chromium 151 and later, and the CrUX API has experimental_-prefixed metrics for them; since they are experimental, it is better to keep them apart for now. This service uses no cookie and no user ID and sends only the metric and the route pattern; whether it must be tied to consent is still your legal team's decision.
When a post is opened in headless Chromium and the visit ends like a user switching tabs, this is the beacon that reaches the server:
$ node rum-check.mjs http://127.0.0.1:52714
beacon sent: POST /rum application/json
POST /rum [{"id":"v6-1794738273883-8816172319866","name":"LCP","value":28,"pageGroup":"/blog/:slug"},{"id":"v6-1794738273907-2134905930601","name":"CLS","value":0,"pageGroup":"/blog/:slug"}]
These values come from a single lab run on a single machine; they are not field data. There is no INP because the visit had no click. The server-side code that collects the beacons and summarizes them with Search Console's rules:
// Thresholds of the Search Console Core Web Vitals report (good is "<=").
public static class CoreWebVitals
{
    public static readonly string[] Metrics = ["LCP", "INP", "CLS"];

    public static Rating Rate(string metric, double value)
    {
        (double good, double poor) = metric switch
        {
            "LCP" => (2500d, 4000d),
            "INP" => (200d, 500d),
            "CLS" => (0.1, 0.25),
            _ => throw new ArgumentOutOfRangeException(nameof(metric), metric, "Not a Core Web Vital."),
        };
        return value <= good ? Rating.Good : value <= poor ? Rating.NeedsImprovement : Rating.Poor;
    }
}

public static class Percentile
{
    // Nearest-rank: the smallest value with at least p of the samples at or below it.
    public static double NearestRank(IReadOnlyList<double> values, double p)
    {
        if (values.Count == 0)
        {
            throw new ArgumentException("No samples.", nameof(values));
        }

        double[] sorted = [.. values.Order()];
        int rank = (int)Math.Ceiling(p * sorted.Length);
        return sorted[Math.Max(rank, 1) - 1];
    }
}
namespace Bookstore.Analytics.Rum;
public sealed record WebVitalSample(string Id, string Metric, double Value, string PageGroup, string FormFactor);
public sealed record MetricSummary(string Metric, int Samples, double P75, Rating Rating);
public sealed record GroupSummary(string PageGroup, string FormFactor, IReadOnlyList<MetricSummary> Metrics, Rating? Status)
{
public bool HasEnoughData => Status is not null;
}
public static class RumReport
{
// Like the Search Console report: a group needs enough LCP and CLS data,
// and its status is its worst metric.
public static List<GroupSummary> Build(IEnumerable<WebVitalSample> samples, int minSamples = 50) =>
samples
.GroupBy(s => (s.PageGroup, s.FormFactor))
.OrderBy(g => g.Key.PageGroup, StringComparer.Ordinal).ThenBy(g => g.Key.FormFactor, StringComparer.Ordinal)
.Select(g =>
{
List<MetricSummary> metrics = CoreWebVitals.Metrics
.Select(m => g.Where(s => s.Metric == m).Select(s => s.Value).ToList())
.Zip(CoreWebVitals.Metrics)
.Where(x => x.First.Count > 0)
.Select(x =>
{
double p75 = Percentile.NearestRank(x.First, 0.75);
return new MetricSummary(x.Second, x.First.Count, p75, CoreWebVitals.Rate(x.Second, p75));
})
.ToList();
bool enough = metrics.Count(m => m.Metric is "LCP" or "CLS" && m.Samples >= minSamples) == 2;
Rating? status = enough ? metrics.Max(m => m.Rating) : null;
return new GroupSummary(g.Key.PageGroup, g.Key.FormFactor, metrics, status);
})
.ToList();
}public static class RumEndpoints
{
// Known route patterns only; free-form URLs would split the data into groups too small for a p75.
private static readonly HashSet<string> PageGroups = new(["/", "/blog/:slug"], StringComparer.Ordinal);
public static IEndpointRouteBuilder MapRum(this IEndpointRouteBuilder app)
{
app.MapPost("/rum", (RumBeacon[] beacons, HttpRequest request, RumStore store) =>
{
string formFactor = FormFactor(request.Headers.UserAgent.ToString());
foreach (RumBeacon b in beacons.Take(10))
{
if (IsValid(b))
{
store.Add(new WebVitalSample(b.Id, b.Name, b.Value,
PageGroups.Contains(b.PageGroup) ? b.PageGroup : "other", formFactor));
}
}
return Results.NoContent();
});To try the report, web/lab/rum-sim.mjs sends the beacons of 180 synthetic visits; the values are made up, not real visitors. Phone and desktop are told apart by the User-Agent:
$ node web/lab/rum-sim.mjs http://127.0.0.1:52706
posted 180 synthetic visits
$ curl -s http://127.0.0.1:52706/rum/report
/ [phone] -> not enough data
    LCP  p75   4665 ms  Poor             n=20
    INP  p75    174 ms  Good             n=10
    CLS  p75      0.02  Good             n=20
/blog/:slug [desktop] -> Good
    LCP  p75   1707 ms  Good             n=80
    INP  p75     86 ms  Good             n=40
    CLS  p75      0.03  Good             n=80
/blog/:slug [phone] -> NeedsImprovement
    LCP  p75   2980 ms  NeedsImprovement n=80
    INP  p75    233 ms  NeedsImprovement n=40
    CLS  p75      0.05  Good             n=80
Read it as in Search Console: /blog/:slug on phones is "NeedsImprovement" because of LCP and INP; even with good CLS, the group's status is its worst metric. On desktop the same pages are "Good", which is why we never mix mobile and desktop. The home page's phone group looks poor on LCP p75, but 20 visits are below the threshold of 50: the report gives no status. The tests check the threshold boundaries (2,500 ms good, 2,501 needs improvement), the nearest-rank percentile, the worst-metric rule, missing CLS data and the endpoint dropping invalid beacons:
$ dotnet test --filter "FullyQualifiedName~RumReportTests|FullyQualifiedName~CruxClientTests|FullyQualifiedName~RumEndpointTests"
Passed!  - Failed:     0, Passed:    13, Skipped:     0, Total:    13, Duration: 198 ms - Bookstore.Analytics.Tests.dll (net10.0)
Production Notes
The in-memory store is a demo. With real traffic, take the beacons into a queue and write them in batches, or send them as metrics to an observability stack; keeping histograms with OpenTelemetry and Prometheus is covered in the Observability series.
Limit cardinality. Unknown routes fall into the other group, at most 10 beacons are accepted per request, and values outside a sensible range are dropped. Since the endpoint is public, remember that bots and fake beacons can skew the data.
Pick the threshold for your traffic. 50 samples is a start; on a low-traffic site you may need a monthly window instead of a weekly one.
Compare RUM with CrUX. They measure different populations: CrUX only eligible Chrome users, RUM all your visitors, but CLS can only be measured in Chromium browsers. Check that they move the same way; do not expect an exact match.
Common Pitfalls
Taking the Lighthouse score for an SEO score. The lab score is for diagnosis; the status in Search Console comes from field data.
Drawing a direct causal line between a Core Web Vitals improvement and a traffic increase. Google says good values do not guarantee rankings; content, season or a core update may have changed in the same period. The honest way to measure the effect is in the last post of the series.
Merging mobile and desktop into a single number. Search Console and CrUX evaluate them separately; a combined p75 can hide two bad results.
Expecting results the day after a fix. CrUX is a 28-day window; Search Console's validation also monitors for 28 days.
A Small Experiment
★☆☆ Open a page of your own site in PageSpeed Insights. Is there field data at the top, or only origin data? Compare Lighthouse's LCP with the field LCP.
★★☆ Add an "approaching" warning to RumReport: mark metrics that are "Good" but whose p75 has passed 90 percent of the threshold. Write its test.
★★★ Write a command that combines CruxClient and RumReport: it shows the CrUX p75 values and the RUM p75 values side by side for the same origin. In the test use the fake handler for CrUX and synthetic samples for RUM.
We have learned to measure; the real question is left: how do we know whether a change worked? In the last post of the series we cover before/after analysis, seasonality, control groups and honest reporting.