

The Aspire Dashboard: Reading Logs, Traces and Metrics, Standalone Use and Telemetry Persistence
The Aspire dashboard is a development tool that shows the logs, traces and metrics services send over OTLP in one place; since 13.6 it stores every run in SQLite and it also runs standalone without Aspire, but it isn't a production observability tool. The post finds an unindexed EF Core query and sequential service calls in a slow order's waterfall and cuts it from 69 ms to 5 ms, and shows aspire otel, export and a standalone dashboard with an API key, with real output.
Version note: The code in this post was built and run with .NET 10, Aspire 13.6 (dashboard 13.6.5), Entity Framework Core 10 and OpenTelemetry .NET 1.21.
Guess First
A small feature was added to Catalog's book detail endpoint for the book page: "more by this author". Ordering doesn't use this field at all; when placing an order it only reads the price. The next day, five-line orders take noticeably longer. Which service's log would you look at to find the cause? And a second question: if you stop and restart the AppHost, are yesterday's traces still in the dashboard? Both answers are in the dashboard.
The Dashboard's Pages
Since 01 we've opened the dashboard and looked at the resource list. There are five pages in the left menu. Resources shows the resources' state, health, URLs and environment variables; among the tabs at the top, Parameters opens the parameters from 02 (secret ones masked), and Graph shows the dependency graph drawn from the WithReference relationships. Console is the process's standard output: Aspire collects it independently of the app, and the SQL Server container's log is here too. Structured logs are the log records sent through OpenTelemetry: the message template, its parameters as separate fields, with trace and span ids. Traces holds the distributed traces and the waterfall view. Metrics shows each resource's meters and instruments. The difference between Console and Structured logs matters: what you see in Console is a line of text; in Structured logs you can filter the same line by its OrderId field and jump to that request's trace with one click. As we saw in 01, the latter needs OpenTelemetry in the service.
Adding Our Own Telemetry
ASP.NET Core, HttpClient and EF Core spans come ready from ServiceDefaults and the client integrations. To also see the business fact "an order was placed", we added an ActivitySource and a Meter to Ordering:
using System.Diagnostics;
using System.Diagnostics.Metrics;

namespace Bookstore.Ordering.Api.Orders;

// Source and meter use the application name, which ServiceDefaults registers with OpenTelemetry
public sealed class OrderingTelemetry
{
    public const string Name = "Bookstore.Ordering.Api";
    public static readonly ActivitySource ActivitySource = new(Name);

    private readonly Counter<long> ordersPlaced;
    private readonly Histogram<double> orderTotal;

    public OrderingTelemetry(IMeterFactory meterFactory)
    {
        Meter meter = meterFactory.Create(Name);
        ordersPlaced = meter.CreateCounter<long>("bookstore.orders.placed", unit: "{order}", description: "Orders placed");
        orderTotal = meter.CreateHistogram<double>("bookstore.orders.total", unit: "TRY", description: "Order total");
    }

    public void OrderPlaced(Order order)
    {
        ordersPlaced.Add(1);
        orderTotal.Record((double)order.Total);
    }
}
On the tracing side the template's ServiceDefaults already listens to the source named after the application with tracing.AddSource(builder.Environment.ApplicationName), but there's no such line on the metrics side. We added our own default for that too:
metrics.AddMeter(builder.Environment.ApplicationName)
    .AddAspNetCoreInstrumentation()
    .AddHttpClientInstrumentation()
    .AddRuntimeInstrumentation();
With this rule, whenever a service opens a source and a meter with the same name as its assembly, they reach the dashboard without extra setup. In the order endpoint we wrapped the part that reads catalog prices in a span called Fetch catalog prices, and when the order is saved we increment the counter and write a structured log. On the Metrics page, bookstore.orders.placed and bookstore.orders.total appear under the Bookstore.Ordering.Api meter, followed by the Microsoft.AspNetCore.Hosting, System.Net.Http and System.Runtime meters. The instrument naming (dot-separated, lower case, unit in a separate field) follows OpenTelemetry's semantic conventions.
The Trace of a Slow Order
To make the slowdown visible we enlarged the catalog: the AppHost gives the migration worker a variable used only locally (.WithEnvironment("Seed__GeneratedBooks", "200000")), and the worker adds 200,000 generated books (2,000 different authors) next to the 5 classics in an empty database. The new feature added to Catalog is this:
// For the book page: up to three other titles by the same author
string[] moreByAuthor = await db.Books.AsNoTracking()
    .Where(b => b.Author == book.Author && b.Isbn != isbn)
    .OrderBy(b => b.Title)
    .Select(b => b.Title)
    .Take(3)
    .ToArrayAsync(ct);
We placed 30 five-line orders through the gateway:
n=30 median=69 ms p95=93 ms max=103 msThe first question from Guess First: which log should you look at? None of them. We opened the trace of the last order on the Traces page:
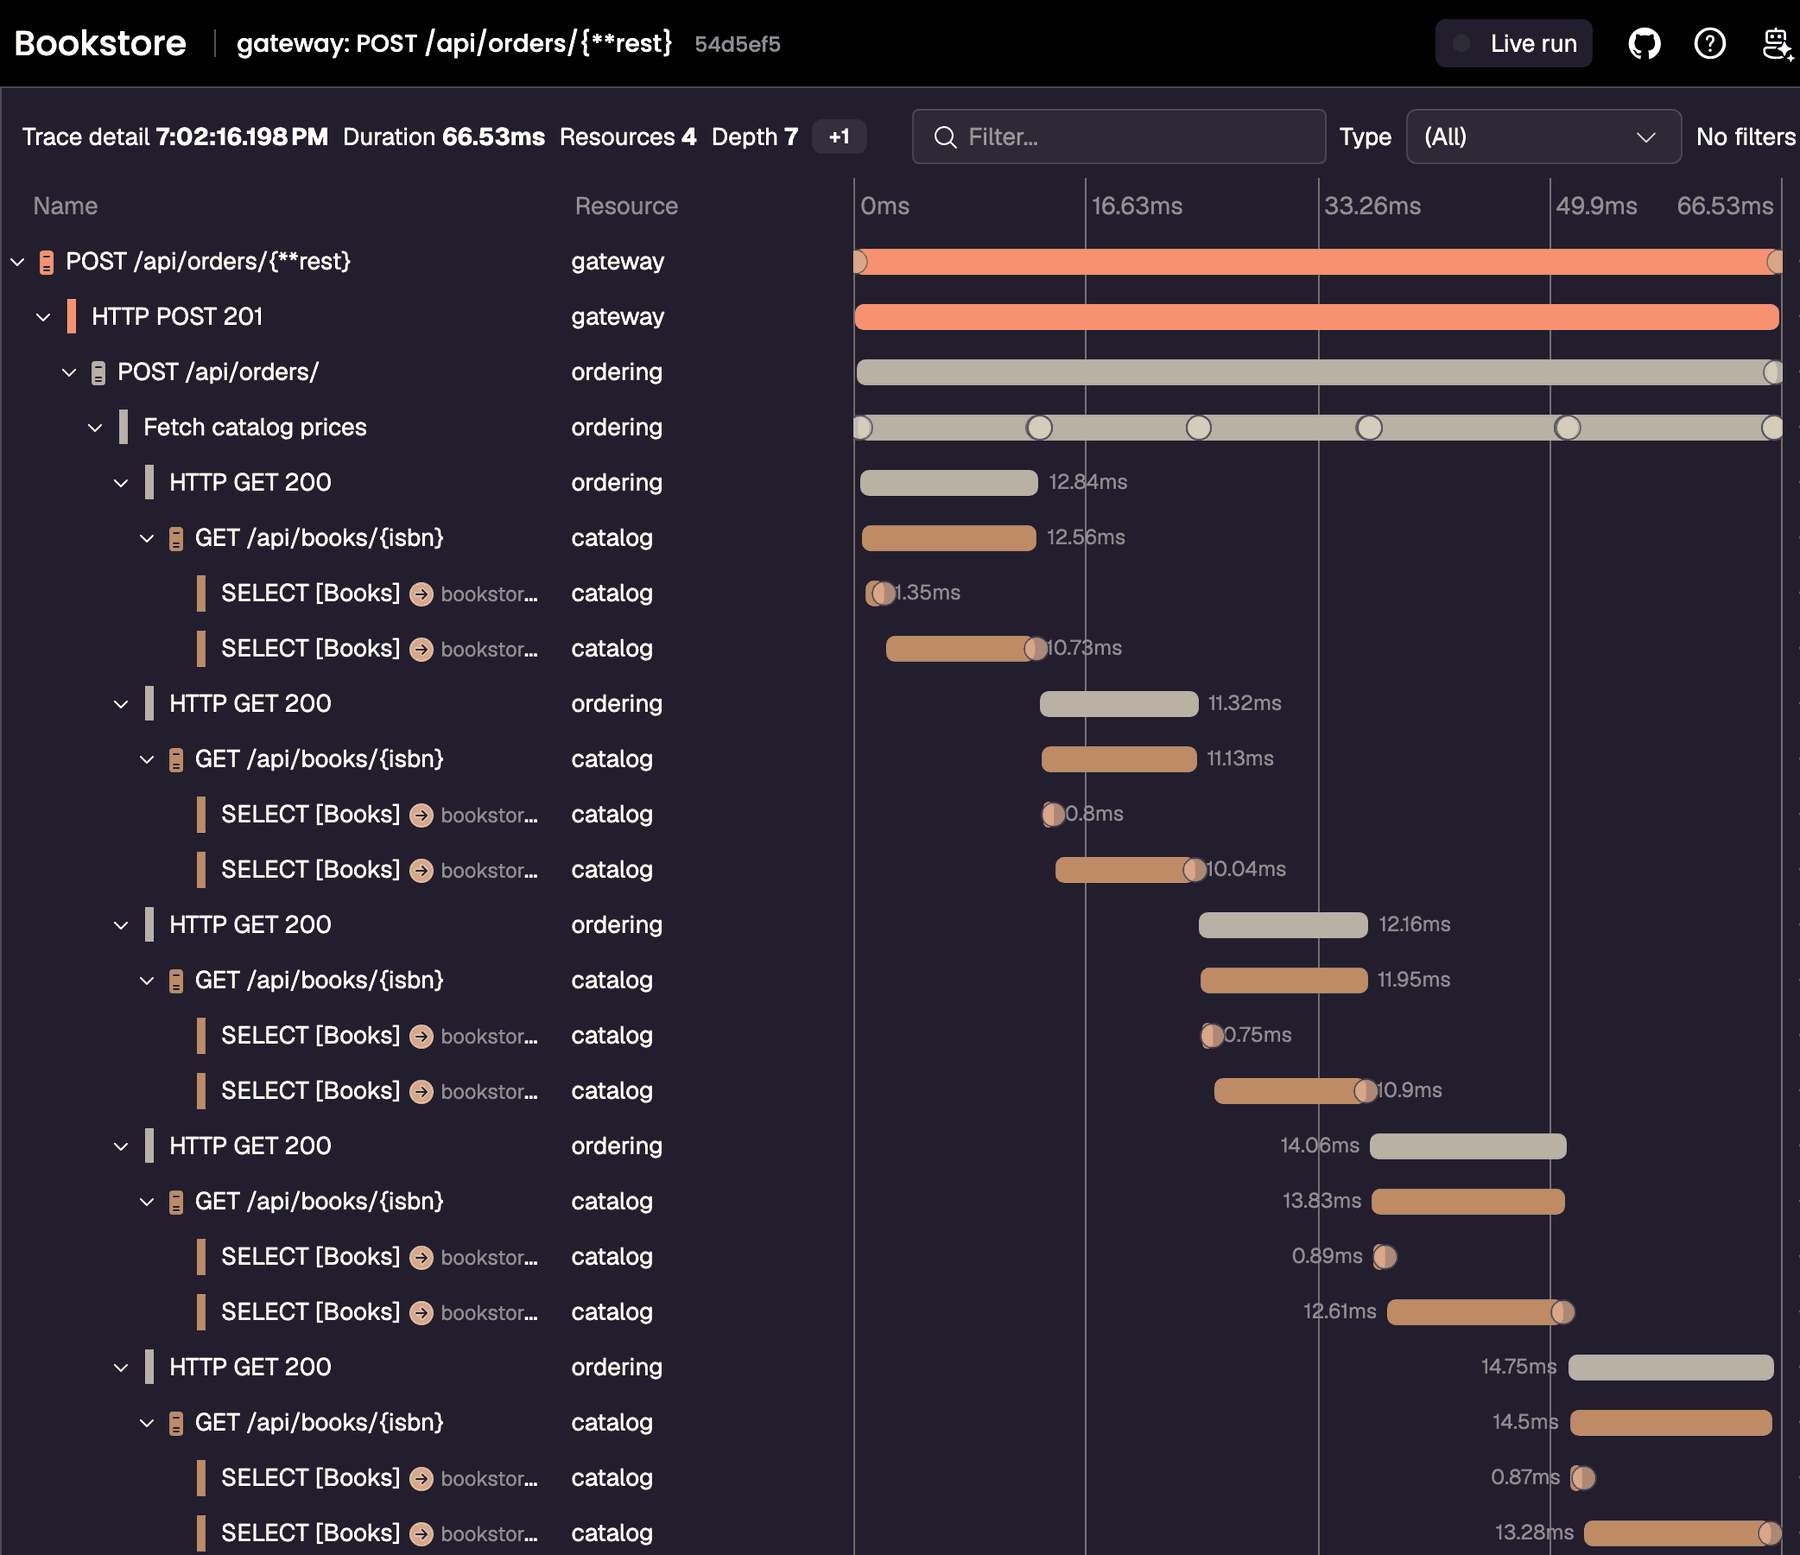
The waterfall says two things at once. The first is the shape: under Ordering's Fetch catalog prices span, five HTTP GET calls line up one after another like a staircase. Each waits for the previous one to finish; five lines, five sequential network calls. The second is the proportion: each Catalog call contains two SQL spans. The first, which finds the book by ISBN, takes about 1 ms; the second takes 10–13 ms, almost all of Catalog's time. Clicking that span shows OpenTelemetry's database attributes in the detail panel:
db.system.name   microsoft.sql_server
db.namespace     BookstoreDb
db.query.summary SELECT [Books]
db.query.text    SELECT TOP(@p) [b].[Title]
                 FROM [Books] AS [b]
                 WHERE [b].[Author] = @book_Author AND [b].[Isbn] <> @isbn
                 ORDER BY [b].[Title]
There's no index on the Author column; SQL Server scans 200,005 rows on every request. A field Ordering never uses takes most of the order's time. There was no way to see this in the logs: every request returned 200 and no log line said "I'm slow".
Two Fixes, Measured
The first is an index: we added book.HasIndex(b => b.Author); to BookstoreContext and generated the AddBookAuthorIndex migration; on the next start the worker ran CREATE INDEX [IX_Books_Author] ON [Books] ([Author]);. The same 30 orders:
n=30 median=22 ms p95=34 ms max=316 msIn the trace the second SQL span dropped from 10–13 ms to 1 ms, but the staircase was still there: five sequential calls, 3 ms each. The second fix is to ask for what Ordering needs in one go. We added a batch lookup endpoint to Catalog for other services:
// Price lookup for other services: one query for many books
books.MapGet("/lookup", async ([FromQuery] string[] isbn, BookstoreContext db, CancellationToken ct) =>
    await db.Books.AsNoTracking()
        .Where(b => isbn.Contains(b.Isbn))
        .Select(b => new BookResponse(b.Isbn, b.Title, b.Author, b.Price, b.Currency))
        .ToListAsync(ct));
Ordering now makes one call per order:
IReadOnlyList<CatalogBook> books = await catalog.GetBooksAsync(request.Items.Select(i => i.Isbn), ct);
Dictionary<string, CatalogBook> byIsbn = books.ToDictionary(b => b.Isbn);
n=30 median=5 ms p95=6 ms max=216 ms
0.0 ms 5 ms gateway: POST /api/orders/{**rest}
0.2 ms 5 ms ordering: POST /api/orders/
0.3 ms 4 ms ordering: Fetch catalog prices
0.4 ms 4 ms ordering: GET http://localhost:5080/api/books/lookup
0.6 ms 4 ms catalog: GET /api/books/lookup
0.9 ms 3 ms catalog: SELECT [Books] ... WHERE [b].[Isbn] IN (@isbn1, @isbn2, @isbn3, @isbn4, @isbn5)From 69 ms to 5 ms. The 216–316 ms in the max values is the JIT and connection pool cost of the first request after the AppHost restarted. The two fixes are in different places: the index solved Catalog's own problem (the book page got faster too), while the batch endpoint fixed the way the two services talk. The waterfall showed both on the same screen. One service calling another in a loop is a typical example of the "chatty" communication covered in the Microservices series.
With 200,000 books, the list endpoint (/api/books) had also started returning everything; we added paging (?page=, 20 books per page) in this step too. Large data reveals early the bugs that small data hides.
Reading Telemetry from the CLI
You can reach the same data without opening the dashboard. We produced the waterfalls above from the output of aspire otel traces gateway -n 1 --format Json. To search logs:
aspire otel logs ordering --search "placed" -n 3

19:02:16.117 INFO ordering Order 01a1dacb-8fb5-7e9a-aa46-71ec1bf387b2 placed with 5 items, total 1709.00 TRY
19:02:16.191 INFO ordering Order 01a1dacb-8fff-7234-8dda-dcdf64f68543 placed with 5 items, total 1709.00 TRY
19:02:16.264 INFO ordering Order 01a1dacb-9048-755e-8fb9-ab0bb3f33749 placed with 5 items, total 1709.00 TRY
aspire otel traces has --has-error and --trace-id filters, aspire otel logs has --severity. They're useful for catching an error in a script, checking after tests in a CI job whether any error traces exist, or handing the output to an AI assistant. The export that came with 13.2 takes the whole session into one file:
aspire export -o bookstore-export.zip
Gathering structured logs...
Gathering traces...
✅ Export saved to bookstore-export.zip
The zip had 27 files: resources/*.json, consolelogs/*.txt, structuredlogs/*.json and traces/*.json for each resource. You can import the file into someone else's dashboard and look at the same traces; a good way to see the session of a teammate who says "it's slow on my machine". But careful: resources/catalog.json also contains environment variables, and the value of ConnectionStrings__bookstoredb held the SQL Server password in plain text. Look inside the export before attaching it to an issue.
Telemetry Persistence: the SQLite Store in 13.6
On to the second question. Before 13.6 the dashboard kept telemetry only in memory; when the AppHost stopped, everything was gone. With 13.6 the default persistence mode of the dashboard the AppHost starts is Run: every run writes to its own SQLite database, and the last 10 completed runs are kept. The "Live run" button in the dashboard's top bar opens this list; for us it listed the start times of the nine earlier runs from that day, and selecting one opens that run's logs and traces read-only. On disk every run is a separate folder:
<ASPIRE_HOME>/dashboard/runs/
    20261114T152311981Z/
        dashboard.db
        run.json
    ...
    20261114T160057661Z/
    20261114T160057661Z.lock
The .lock file marks the run being written right now. You change the mode with ASPIRE_DASHBOARD_PERSISTENCE_MODE: None is the old behavior (memory only), Resume keeps using the same database across runs. The location changes with ASPIRE_DASHBOARD_DATA_DIRECTORY. The limits went up in 13.6 too: the default cap for logs, traces and console logs is 100,000 entries; when it fills up, the oldest entries are removed. A security note: the SQLite file isn't encrypted separately and contains whatever is in the logs or span attributes. On Unix Aspire creates the file with owner-only permissions, but on Windows it doesn't set ACLs; keep this folder out of backups and shared drives.
The Standalone Dashboard: for an App That Doesn't Use Aspire
The dashboard itself isn't tied to the AppHost. Any app that speaks OTLP can send its telemetry to it. If you need a local trace viewer and your project doesn't use Aspire, this is the shortest way. We started it with the CLI and made an API key mandatory for OTLP:
aspire dashboard run --application-name bookstore-standalone -- \
  --Dashboard:Otlp:AuthMode=ApiKey --Dashboard:Otlp:PrimaryApiKey=<key>

   Dashboard:  http://localhost:18888/login?t=<token>
   OTLP/gRPC:  http://localhost:4317
   OTLP/HTTP:  http://localhost:4318
The UI is protected by a browser token (as with the AppHost), and the OTLP endpoints require the API key. We ran Ordering outside the AppHost twice and placed one order each time. The first time it only had OTEL_EXPORTER_OTLP_ENDPOINT=http://localhost:4317 and OTEL_SERVICE_NAME=ordering-standalone; the second time also OTEL_EXPORTER_OTLP_HEADERS=x-otlp-api-key=<key>. Both requests returned 201, but only one showed up in the dashboard:
aspire otel traces ordering-standalone --dashboard-url "http://localhost:18888/login?t=<token>"

19:06:24.665  ordering-standalone: POST /api/orders/ 5e49808   3 spans
Showing 1 of 1 traces
The telemetry without the key was rejected, and the app didn't notice: an exporter failure doesn't affect the request. If telemetry doesn't show up, check the header first. The span count in the trace is instructive too: 3. Catalog was still running under the AppHost and sending its spans to the other dashboard. The trace context travelled to Catalog with the request, but the spans were collected in two different places; to see a whole trace, all services have to send to the same place.
The standalone dashboard's persistence default is None. We stopped the dashboard and restarted it with the same command, and the same query returned Resource 'ordering-standalone' not found. If you want to keep the data, pass --persistence Resume. It also works as a container without installing the CLI: the mcr.microsoft.com/aspire/dashboard image exposes ports 18888 (UI), 18889 (OTLP/gRPC) and 18890 (OTLP/HTTP), and the login token is written to the container log. We didn't run this variation; it's taken from the documentation.
What the Dashboard Isn't
It isn't a production observability tool. The Aspire documentation positions it for development and short-term diagnostics too. The reasons are concrete: it runs on a single machine, keeps data up to 100,000 entries and the last 10 runs at most, you can't set up alerts, it has no user and permission model (a single login through a browser token or OpenID Connect), and it writes to an unencrypted file. In production the same OTLP data goes through an OpenTelemetry Collector to backends such as Prometheus, Grafana, Tempo and Loki, or to an APM service; those are the topic of the Observability series. The nice part is that the service code doesn't change. The OpenTelemetry setup in ServiceDefaults sends to the dashboard locally and to the Collector in production; only OTEL_EXPORTER_OTLP_ENDPOINT changes.
In Production
Locally everything is sampled: Aspire gives services OTEL_TRACES_SAMPLER=always_on. In production, keeping every span of every request is expensive; make the sampling decision at the Collector or backend, and don't carry the local settings into production.
The db.query.text attribute carries the query text. Parameters stay as names such as @isbn and their values don't go into the span; but if you build queries by concatenating strings, the values end up in the text. Check that telemetry doesn't carry personal data before going to production.
Be careful with tags on custom metrics. Adding a tag such as the customer's email or the order id to bookstore.orders.placed means a separate time series for every value; the backend's cost and query time grow accordingly. High-cardinality information belongs in spans and logs, low-cardinality information (payment method, channel) in metrics.
Common Pitfalls
Looking for slowness in the logs. The problem in this post didn't appear in any log; every request succeeded. The answer to "how long" is in the trace, the answer to "how often" is in the metrics.
Forgetting to register a custom source or meter. If you pick a name different from the application name, such as new ActivitySource("Bookstore.Orders"), the spans and metrics go nowhere unless you add AddSource/AddMeter to ServiceDefaults, and there's no error either.
Assuming the export file and the dashboard database are harmless. Both contain environment variables, connection strings and whatever you wrote into logs.
Forgetting to give the app the OTLP key with the standalone dashboard. Requests succeed, the dashboard stays empty; there's no visible error on the app side.
Treating local measurements as absolute. 69 ms and 5 ms are our machine's numbers; what matters is the ratio and the shape of the waterfall. Instead of comparing with a fixed threshold, measure before and after in the same environment.
A Small Experiment
★☆☆ On the Structured logs page, filter by the OrderId field and go from an order's log line to that request's waterfall with "View trace". What does the same log line look like on the Console page?
★★☆ Drop the index by hand in SQL Server (DROP INDEX IX_Books_Author ON Books) and measure the version with the batch endpoint. How long does a single /lookup call take without the index? Why?
★★★ Start the AppHost twice with ASPIRE_DASHBOARD_PERSISTENCE_MODE=Resume and confirm that the traces of the first run also appear in the second. Then open dashboard.db with a SQLite client and check whether a connection string appears anywhere.
We've learned to read the dashboard; so far we've used SQL Server and Redis without opening up the integrations. In the next post we move on to hosting and client integrations: what a client integration adds, examples with SQL Server, Redis, RabbitMQ and Keycloak, writing your own resource and adding a command to the dashboard. Once RabbitMQ is in, we'll also see a message's consumer span in this waterfall; how trace context travels in messaging is covered in the Observability in Messaging post of the Message Queue'larla Çalışmak series.