

Taking a Go Service to Production: slog, Configuration, Graceful Shutdown, pprof and Small Containers
Getting a Go service ready for production means reading settings from environment variables into a struct, writing JSON logs with log/slog, catching SIGTERM with signal.NotifyContext and exiting through server.Shutdown, adding health checks and serving pprof on a separate port. In Bookstore: slog with the request ID, a drain delay, measuring container-aware GOMAXPROCS and GOMEMLIMIT, builds with -trimpath and ldflags, and a 4.72 MB distroless image.
Version note: The code in this post was built and run with Go 1.27.4; the module's go line is 1.26.0 and the code also builds and passes its tests with Go 1.26.11. log/slog arrived in Go 1.21, slog.NewMultiHandler in Go 1.26; container-aware GOMAXPROCS has been the default since Go 1.25 and the Green Tea GC since Go 1.26. The container image was built for linux/amd64 with golang:1.27.4 and gcr.io/distroless/static-debian13:nonroot.
Guess First
I put the Go API of Bookstore, the online bookstore used as the shared example across this site's series, into a container as it was at the end of post 12. main still ends with log.Fatal(srv.ListenAndServe()); there is no code dealing with signals. docker stop first sends SIGTERM and waits 10 seconds, and if the process has not exited it kills it with SIGKILL. How many seconds does this service take to stop, and with which exit code?
$ docker run -d --name goseries-api -p 127.0.0.1:52714:8080 goseries-bookstore-api:12
$ time docker stop goseries-api
goseries-api
real 0.19
$ docker inspect goseries-api --format 'exit={{.State.ExitCode}}'
exit=143
0.19 seconds and 143, which is 128 + 15: the process died of SIGTERM. If you have not installed a handler for SIGTERM, the Go runtime applies the default action and ends the process at once. There is not a single line about shutting down in the log; if a request was being handled at that moment, its response is cut off. In this post we get the service ready for production: structured logging with log/slog, reading configuration from environment variables, graceful shutdown and health check endpoints, net/http/pprof on a separate port, GOMAXPROCS, GOMEMLIMIT and the GC, and finally a small container image.
Configuration: A Struct from Environment Variables
Since post 09 the listen address and the CORS origin have been hard-coded. In a container the server must listen on :8080, not 127.0.0.1; in production the origin is not localhost:4200. Go has no ready-made system like IConfiguration or the options pattern; most services read their settings from environment variables into a struct:
// Config holds every setting the service reads at start-up.
type Config struct {
    Addr            string        // BOOKSTORE_ADDR: public API
    DebugAddr       string        // BOOKSTORE_DEBUG_ADDR: pprof; "off" disables it
    CORSOrigin      string        // BOOKSTORE_CORS_ORIGIN: the Angular app
    DatabaseURL     string        // BOOKSTORE_DB: empty keeps orders in memory
    LogFormat       string        // BOOKSTORE_LOG_FORMAT: json or text
    LogLevel        slog.Level    // BOOKSTORE_LOG_LEVEL: debug, info, warn, error
    DrainDelay      time.Duration // BOOKSTORE_DRAIN_DELAY: /readyz fails this long before shutdown
    ShutdownTimeout time.Duration // BOOKSTORE_SHUTDOWN_TIMEOUT: time for requests in flight
}
// FromEnv builds a Config from getenv (os.Getenv in main, a map in tests).
// It reports every invalid setting at once, not only the first.
func FromEnv(getenv func(string) string) (Config, error) {
get := func(key, def string) string {
if v := getenv(key); v != "" {
return v
}
return def
}
c := Config{
Addr: get("BOOKSTORE_ADDR", "127.0.0.1:52710"),
DebugAddr: get("BOOKSTORE_DEBUG_ADDR", "127.0.0.1:52711"),
CORSOrigin: get("BOOKSTORE_CORS_ORIGIN", "http://localhost:4200"),
DatabaseURL: getenv("BOOKSTORE_DB"),
LogFormat: get("BOOKSTORE_LOG_FORMAT", "json"),
}
var errs []error
if _, _, err := net.SplitHostPort(c.Addr); err != nil {
errs = append(errs, fmt.Errorf("BOOKSTORE_ADDR: %w", err))
}
if c.DebugAddr == "off" {
c.DebugAddr = ""
} else if _, _, err := net.SplitHostPort(c.DebugAddr); err != nil {
errs = append(errs, fmt.Errorf("BOOKSTORE_DEBUG_ADDR: %w", err))
}
if u, err := url.Parse(c.CORSOrigin); err != nil || (u.Scheme != "http" && u.Scheme != "https") || u.Host == "" || u.Path != "" {
errs = append(errs, fmt.Errorf("BOOKSTORE_CORS_ORIGIN: %q is not an origin like https://shop.example.com", c.CORSOrigin))
}
if c.LogFormat != "json" && c.LogFormat != "text" {
errs = append(errs, fmt.Errorf("BOOKSTORE_LOG_FORMAT: %q is not json or text", c.LogFormat))
}
if err := c.LogLevel.UnmarshalText([]byte(get("BOOKSTORE_LOG_LEVEL", "info"))); err != nil {
errs = append(errs, fmt.Errorf("BOOKSTORE_LOG_LEVEL: %w", err))
}
if d, err := time.ParseDuration(get("BOOKSTORE_DRAIN_DELAY", "0s")); err != nil || d < 0 {
errs = append(errs, fmt.Errorf("BOOKSTORE_DRAIN_DELAY: %q is not a duration like 5s", getenv("BOOKSTORE_DRAIN_DELAY")))
} else {
c.DrainDelay = d
}
if d, err := time.ParseDuration(get("BOOKSTORE_SHUTDOWN_TIMEOUT", "20s")); err != nil || d <= 0 {
errs = append(errs, fmt.Errorf("BOOKSTORE_SHUTDOWN_TIMEOUT: %q is not a positive duration like 20s", getenv("BOOKSTORE_SHUTDOWN_TIMEOUT")))
} else {
c.ShutdownTimeout = d
}
return c, errors.Join(errs...)
}FromEnv does not call os.Getenv directly; it takes it as a function. main passes os.Getenv, the test passes a small function that reads from a map; as in post 12, a table-driven test does not need to change the global environment. All errors are collected with errors.Join, so three mistyped settings do not take three deployment attempts:
$ BOOKSTORE_ADDR=8080 BOOKSTORE_LOG_LEVEL=loud BOOKSTORE_CORS_ORIGIN=localhost:4200 ./bookstore-api
bookstore-api: BOOKSTORE_ADDR: address 8080: missing port in address
BOOKSTORE_CORS_ORIGIN: "localhost:4200" is not an origin like https://shop.example.com
BOOKSTORE_LOG_LEVEL: slog: level string "loud": unknown name
$ echo $?
1
With a wrong setting the service does not start at all; Kubernetes sees that as a crash and the rollout does not proceed. That is better than a half-working service. I saw the benefit while writing this post: another application on the machine had started using 52710, the service exited at once with listen tcp 127.0.0.1:52710: bind: address already in use, and all I had to do was set BOOKSTORE_ADDR=127.0.0.1:52715. If the number of settings grows, there are libraries such as caarlos0/env that read them through struct tags; secrets such as passwords should reach the environment variable from a Kubernetes Secret or a secret manager, not from the repo.
log/slog: Structured Logging and the Request ID
The log.Printf lines from post 09 were readable for people, but searching a log system for "requests with status 500" needs the fields to be separate. log/slog from Go 1.21 does a job similar to ILogger and Serilog's message templates: every record is a message plus key-value fields, and the handler writes them as JSON or as key=value text. The logging middleware now looks like this:
// Logging writes one structured record per request after the handler
// returns. The request ID is added by the handler from NewLogHandler.
func Logging(logger *slog.Logger) Middleware {
    return func(next http.Handler) http.Handler {
        return http.HandlerFunc(func(w http.ResponseWriter, r *http.Request) {
            start := time.Now()
            rec := &statusRecorder{ResponseWriter: w}
            next.ServeHTTP(rec, r)
            logger.InfoContext(r.Context(), "request",
                "method", r.Method,
                "path", r.URL.RequestURI(),
                "status", rec.status,
                "bytes", rec.bytes,
                "duration_ms", float64(time.Since(start).Microseconds())/1000,
            )
        })
    }
}
Instead of adding the request ID to every log call by hand, I wrap the handler. slog.Handler is a four-method interface; Handle adds the request ID to the record if the context has one:
// NewLogHandler wraps h so that every record logged with a request's
// context carries that request's ID.
func NewLogHandler(h slog.Handler) slog.Handler {
    return logHandler{h}
}

type logHandler struct{ slog.Handler }

func (h logHandler) Handle(ctx context.Context, r slog.Record) error {
    if id := RequestIDFrom(ctx); id != "" {
        r.AddAttrs(slog.String("request_id", id))
    }
    return h.Handler.Handle(ctx, r)
}

// WithAttrs and WithGroup must wrap again; the embedded methods would
// return the inner handler and lose the request ID.
func (h logHandler) WithAttrs(attrs []slog.Attr) slog.Handler {
    return logHandler{h.Handler.WithAttrs(attrs)}
}

func (h logHandler) WithGroup(name string) slog.Handler {
    return logHandler{h.Handler.WithGroup(name)}
}
So every call such as a.Log.ErrorContext(r.Context(), "place order", "error", err) carries the request_id field without doing anything itself; that was the promise from post 09. This is the counterpart of logging scopes in ASP.NET Core. Overriding WithAttrs and WithGroup is required; the pitfalls below explain why. The logger is built in run, and the JSON output looks like this:
func newLogger(cfg config.Config, out io.Writer) *slog.Logger {
    opts := &slog.HandlerOptions{Level: cfg.LogLevel}
    var h slog.Handler = slog.NewJSONHandler(out, opts)
    if cfg.LogFormat == "text" {
        h = slog.NewTextHandler(out, opts)
    }
    return slog.New(httpapi.NewLogHandler(h))
}
{"time":"2026-11-15T05:31:40.561594+03:00","level":"INFO","msg":"starting","version":"1.13.0","go":"go1.27.4","gomaxprocs":4,"memory_limit":9223372036854775807}
{"time":"2026-11-15T05:31:40.5619+03:00","level":"INFO","msg":"listening","addr":"127.0.0.1:52711"}
{"time":"2026-11-15T05:31:40.56191+03:00","level":"INFO","msg":"listening","addr":"127.0.0.1:52710"}
{"time":"2026-11-15T05:31:42.328924+03:00","level":"INFO","msg":"request","method":"GET","path":"/hello","status":200,"bytes":25,"duration_ms":0.026,"request_id":"hello-1"}
{"time":"2026-11-15T05:31:42.341447+03:00","level":"INFO","msg":"request","method":"GET","path":"/api/books/9780000000000","status":404,"bytes":35,"duration_ms":0.024,"request_id":"7VG6OBFAUC52"}slog.SetDefault(logger) has a side effect: the output of the old log package now goes through this handler too. For the internal errors of http.Server itself I also set ErrorLog: slog.NewLogLogger(logger.Handler(), slog.LevelWarn), so messages such as TLS handshake errors come out as JSON as well. The recover middleware now writes a panic as a single record with its stack trace and returns a 500 in the Problem Details shape from post 10; as in post 12, it has a test (TestRecoverLogsStack).
slog.NewMultiHandler from Go 1.26 sends one record to several handlers. labs/13-multihandler writes everything to stdout as JSON, and warnings and errors to stderr as text as well:
func main() {
    noTime := func(_ []string, a slog.Attr) slog.Attr {
        if a.Key == slog.TimeKey {
            return slog.Attr{} // keep the output short for the post
        }
        return a
    }
    logger := slog.New(slog.NewMultiHandler(
        slog.NewJSONHandler(os.Stdout, &slog.HandlerOptions{ReplaceAttr: noTime}),
        slog.NewTextHandler(os.Stderr, &slog.HandlerOptions{Level: slog.LevelWarn, ReplaceAttr: noTime}),
    ))
    logger = logger.With("service", "bookstore-api")

    logger.Info("order placed", "order_id", "ORD-1001", "total_kurus", 69980)
    logger.Warn("stock low", "isbn", "9780141439686", "stock", 1)
}
--- stdout
{"level":"INFO","msg":"order placed","service":"bookstore-api","order_id":"ORD-1001","total_kurus":69980}
{"level":"WARN","msg":"stock low","service":"bookstore-api","isbn":"9780141439686","stock":1}
--- stderr
level=WARN msg="stock low" service=bookstore-api isbn=9780141439686 stock=1Collecting logs and linking them to traces with OpenTelemetry belongs to the Observability series; the only job on the Go side is writing JSON to stdout.
Graceful Shutdown and Health Checks
main is now small: it ties the signal to a context and leaves the real work to run. Because run returns an error, unlike log.Fatal, the defers (for example db.Close()) get to run:
func main() {
    // The context is cancelled on Ctrl+C and on SIGTERM, which is what
    // docker stop and Kubernetes send before they kill the process.
    ctx, stop := signal.NotifyContext(context.Background(), os.Interrupt, syscall.SIGTERM)
    defer stop()
    if err := run(ctx, os.Getenv, os.Stdout); err != nil {
        fmt.Fprintln(os.Stderr, "bookstore-api:", err)
        os.Exit(1)
    }
}
errc := make(chan error, len(servers))
for _, s := range servers {
go func() {
logger.Info("listening", "addr", s.Addr)
if err := s.ListenAndServe(); !errors.Is(err, http.ErrServerClosed) {
errc <- err
}
}()
}
select {
case err := <-errc: // e.g. the port is already in use
return err
case <-ctx.Done():
}
// Graceful shutdown: fail readiness and give the load balancer
// DrainDelay to notice, then stop accepting connections and let requests
// in flight finish, but not longer than ShutdownTimeout.
logger.Info("shutting down", "drain_delay", cfg.DrainDelay.String(), "timeout", cfg.ShutdownTimeout.String())
health.Drain()
time.Sleep(cfg.DrainDelay) // the server keeps serving meanwhile
shutdownCtx, cancel := context.WithTimeout(context.Background(), cfg.ShutdownTimeout)
defer cancel()
var errs []error
for _, s := range servers {
errs = append(errs, s.Shutdown(shutdownCtx))
}
if err := errors.Join(errs...); err != nil {
return fmt.Errorf("shutdown: %w", err)
}
logger.Info("stopped")
return nil
}signal.NotifyContext cancels the context when SIGTERM or Ctrl+C arrives; the signal no longer kills the process, it only closes ctx.Done(). ListenAndServe returns http.ErrServerClosed the moment Shutdown is called; that is why the goroutine does not treat this as an error and run waits until Shutdown finishes. Shutdown closes the listeners, closes idle connections, and waits until the requests in flight are done or the context expires. It does not wait for hijacked connections such as WebSockets; RegisterOnShutdown exists for those.
The health endpoints answer two different questions. /healthz (liveness) asks "is the process alive?"; if it does not answer, Kubernetes restarts the container. /readyz (readiness) asks "can it take traffic?"; it pings the database and returns 503 once shutdown has started:
// Ready answers 200 only when the API can do useful work.
func (h *Health) Ready(w http.ResponseWriter, r *http.Request) {
    if h.draining.Load() {
        http.Error(w, "shutting down", http.StatusServiceUnavailable)
        return
    }
    if h.Check != nil {
        ctx, cancel := context.WithTimeout(r.Context(), 2*time.Second)
        defer cancel()
        if err := h.Check(ctx); err != nil {
            slog.WarnContext(ctx, "readiness check failed", "error", err)
            http.Error(w, "not ready", http.StatusServiceUnavailable)
            return
        }
    }
    w.Write([]byte("ready\n"))
}
Keeping the database check out of liveness is deliberate: when the database goes away for a minute, restarting every pod does not solve the problem, it makes it bigger. DrainDelay is for a timing problem in Kubernetes. Kubernetes removes the pod from the service endpoints while it sends SIGTERM, but the two do not finish at the same time; the load balancer can keep sending requests to the old pod for a few more seconds. If the service has closed its listener by then, those requests get "connection refused". I sent SIGTERM with BOOKSTORE_DRAIN_DELAY=3s while a 5-second CPU profile was running, and called /readyz every half second (summarised with uniq -c):
SIGTERM 05:36:04.1
profile 200 5.077082s
   3 05:36:02.6 200
   6 05:36:04.2 503
   7 05:36:07.5 000
{"time":"2026-11-15T05:36:04.060953+03:00","level":"INFO","msg":"shutting down","drain_delay":"3s","timeout":"20s"}
{"time":"2026-11-15T05:36:08.13009+03:00","level":"INFO","msg":"stopped"}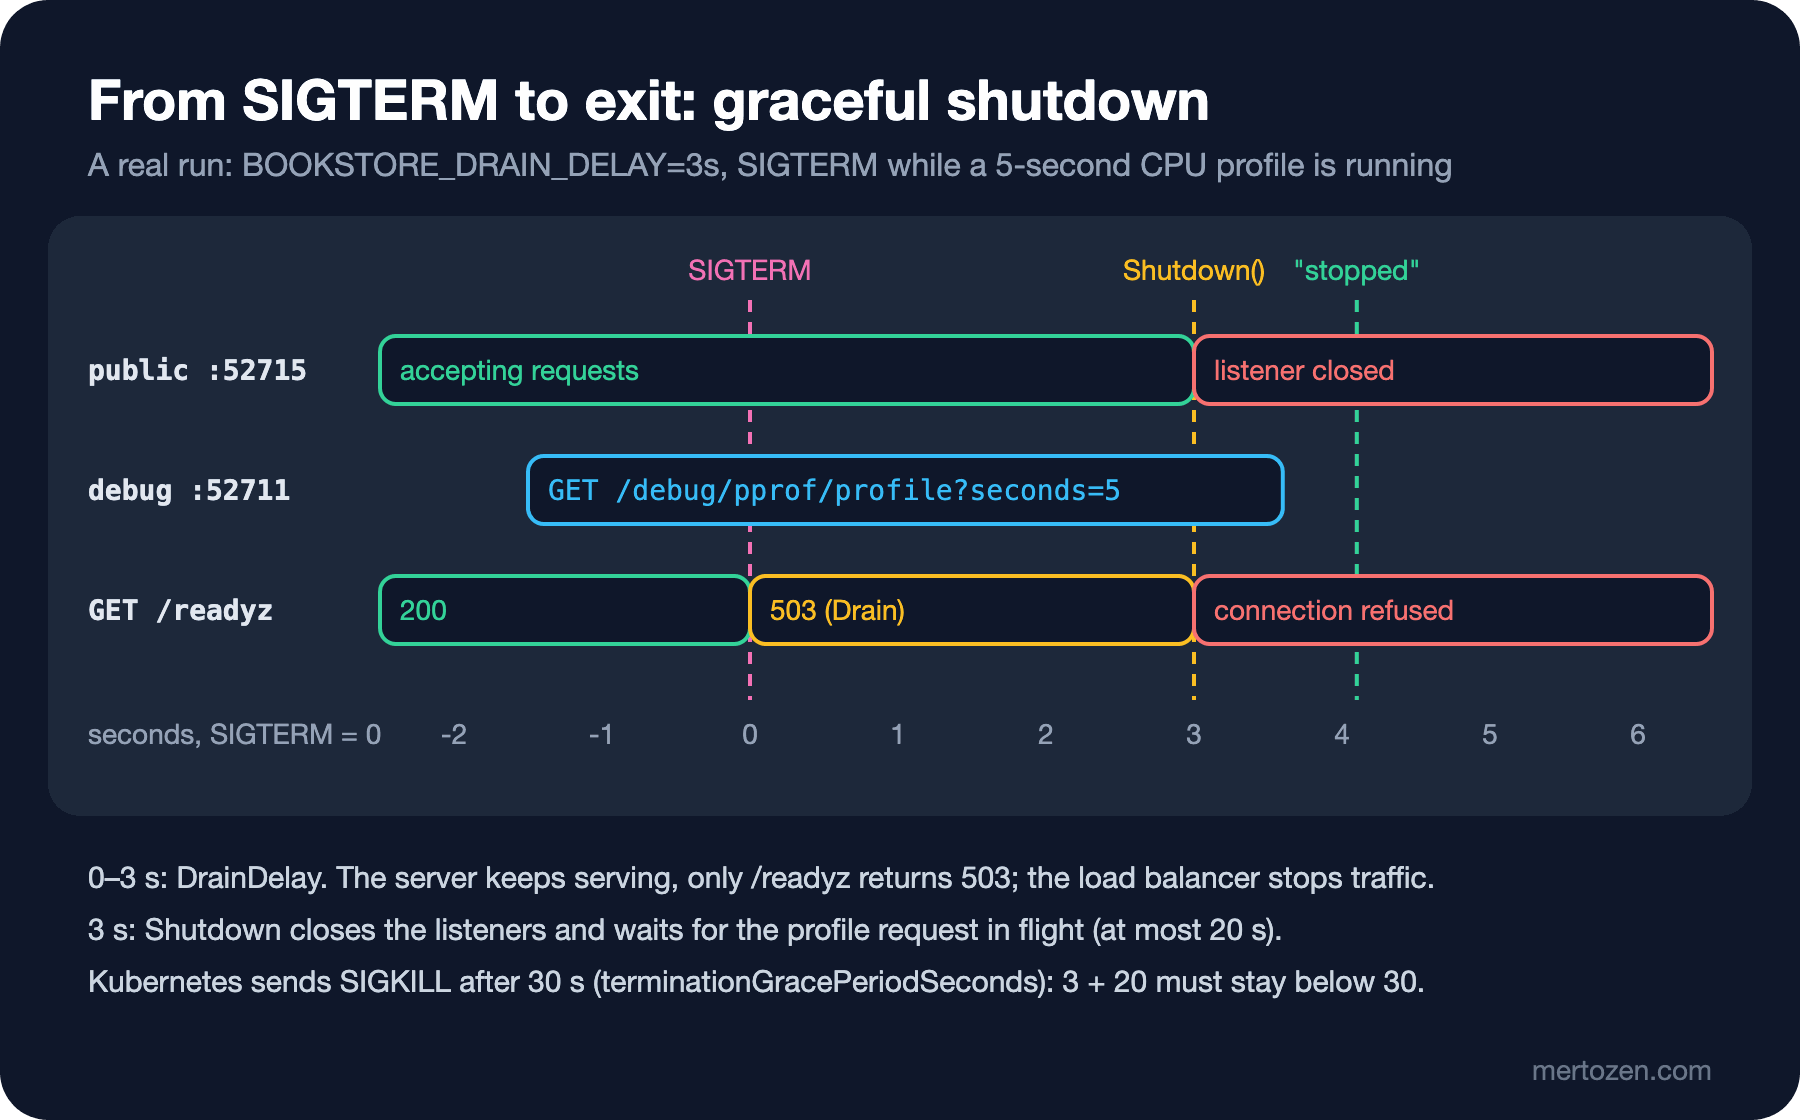
For three seconds the server kept running but /readyz returned 503; then the listener closed (000 means curl could not connect) and Shutdown waited for the profile request to finish; the profile completed with a 200. In Kubernetes the same effect can also be had with a preStop hook; with the wait inside the application it also works the same way under Docker and elsewhere. The new version of the image from Guess First prints this on docker stop and exits with 0:
{"time":"2026-11-15T02:37:02.190430044Z","level":"INFO","msg":"shutting down","drain_delay":"0s","timeout":"20s"}
{"time":"2026-11-15T02:37:02.191183252Z","level":"INFO","msg":"stopped"}
exit=0
pprof: Profiles on a Separate Port
net/http/pprof serves CPU, heap, goroutine and the goroutineleak profile we saw in post 08 over HTTP. When the package is imported it registers its handlers on http.DefaultServeMux; since we never serve DefaultServeMux, that registration is not exposed. We put the handlers on our own mux, in a separate server, and only on 127.0.0.1:
// debugMux serves the profiles of net/http/pprof on their own mux. The
// package also registers them on http.DefaultServeMux, which we never serve.
func debugMux() *http.ServeMux {
    mux := http.NewServeMux()
    mux.HandleFunc("GET /debug/pprof/", pprof.Index) // heap, goroutine, goroutineleak, allocs...
    mux.HandleFunc("GET /debug/pprof/profile", pprof.Profile)
    mux.HandleFunc("GET /debug/pprof/symbol", pprof.Symbol)
    mux.HandleFunc("GET /debug/pprof/trace", pprof.Trace)
    return mux
}
cmdline is left out on purpose: it returns the process's command line, and that may contain a password. On the public server /debug/pprof/ returns 404; the index on the debug server lists these:
$ curl -s http://127.0.0.1:52711/debug/pprof/ | sed -e 's/<[^>]*>//g'
...
3   allocs
0   block
7   goroutine
0   goroutineleak
3   heap
0   mutex
8   threadcreate
...
$ curl -s 'http://127.0.0.1:52711/debug/pprof/goroutineleak?debug=1'
goroutineleak profile: total 0
In the container the debug address is the container's own 127.0.0.1, so it cannot be reached from outside; when needed it is opened with kubectl port-forward. I took the 5-second profile from the graceful shutdown run while 8 parallel clients were sending POST /api/orders. The relevant lines of go tool pprof -top -focus=bookstore/ cpu.pb.gz (I removed the platform-specific runtime lines):
Duration: 5.06s, Total samples = 250ms ( 4.94%)
      flat  flat%   sum%        cum   cum%
      10ms  4.00% 36.00%       20ms  8.00%  encoding/json/jsontext.(*decoderState).consumeObject
      10ms  4.00% 44.00%       10ms  4.00%  log/slog.Value.Kind (inline)
         0     0% 44.00%       20ms  8.00%  bookstore/internal/httpapi.(*API).placeOrder
         0     0% 44.00%       90ms 36.00%  bookstore/internal/httpapi.Logging.func1.1
         0     0% 44.00%       20ms  8.00%  bookstore/internal/httpapi.Recover.func1.1
         0     0% 44.00%       20ms  8.00%  bookstore/internal/httpapi.decodeJSON
Two things stand out. First, Logging has a cum value of 90 ms, and the rest of the chain inside it (from Recover to the handler) 20 ms. So about 70 ms of the 5-second sample went to writing a synchronous JSON line to stdout for every request; next to a handler this small, the log line costs more than the work itself. Second, although we call the v1 json.Decoder from post 10, the stack contains encoding/json/jsontext; the profile also shows that in Go 1.27 v1 runs on top of v2.
GOMAXPROCS, GOMEMLIMIT and the Green Tea GC
This is why I put gomaxprocs and memory_limit into the start-up log. I ran the container with a CPU and a memory limit:
$ docker run -d --name goseries-api --cpus=1.5 --memory=256m -e GOMEMLIMIT=200MiB \
    -e BOOKSTORE_DEBUG_ADDR=off -p 127.0.0.1:52714:8080 goseries-bookstore-api:13
$ docker logs goseries-api | head -1
{"time":"2026-11-15T02:36:58.174650542Z","level":"INFO","msg":"starting","version":"1.13.0","go":"go1.27.4","gomaxprocs":2,"memory_limit":209715200}
Since Go 1.25 the runtime sets GOMAXPROCS from the container's CPU limit: for --cpus=1.5 it became 2. With the same image, --cpus=1 also gave 2 and --cpus=3.2 gave 4; the value is rounded up and does not go below 2. If the limit changes, the runtime updates the value periodically. This behaviour looks at the CPU limit in Kubernetes, not the CPU request. That is why the uber-go/automaxprocs library, used for the same job before, is mostly no longer needed. If you set GOMAXPROCS as an environment variable, the automatic setting is turned off.
There is no such thing for memory. memory_limit is 209715200 because I set GOMEMLIMIT=200MiB; in the runs where I did not, it was 9223372036854775807, that is, unlimited. The runtime does not read the container's memory limit. GOMEMLIMIT (Go 1.19) is a soft limit that tells the GC "collect more often when the heap gets close to this"; without it the GC looks only at GOGC (default 100: collect when the heap has grown by as much as the live data), and when traffic grows the heap can exceed the container limit and the process gets OOM-killed. As a rule I set it to about 80–90% of the container limit; 200 MiB for --memory=256m.
The Green Tea GC, the default since Go 1.26, lowers the CPU cost of the GC by scanning small objects page by page in memory rather than one by one; the release notes expect a 10–40% reduction in real programs. No code change is needed. If it causes trouble, it can be turned off at build time with GOEXPERIMENT=nogreenteagc. The Go 1.26 release notes expected this option to be removed in 1.27; I tried it with 1.27.4, it still works, and the line build GOEXPERIMENT=nogreenteagc shows up in the go version -m output.
Builds and a Small Container Image
The strongest part of Go's deployment story is a single static binary. The same command also produces a Linux binary on Windows:
$ CGO_ENABLED=0 GOOS=linux GOARCH=amd64 go build -o default ./cmd/bookstore-api
$ CGO_ENABLED=0 GOOS=linux GOARCH=amd64 go build -trimpath -ldflags "-s -w -X main.version=1.13.0" -o small ./cmd/bookstore-api
$ CGO_ENABLED=0 GOOS=windows GOARCH=amd64 go build -trimpath -ldflags "-s -w -X main.version=1.13.0" -o bookstore-api.exe ./cmd/bookstore-api
13224317 default
 9216160 small
 9494016 bookstore-api.exe
CGO_ENABLED=0 gives a static binary that does not depend on C libraries; it is needed to run in images without a C runtime, such as scratch or distroless. -trimpath removes the build machine's folders from the file paths in the binary. -ldflags "-s -w" drops the symbol table and the DWARF section: from 13.2 MB to 9.2 MB. Panic stack traces still show function names and line numbers, because Go keeps those in a separate table; what you lose is inspecting the binary with a debugger such as Delve. -X main.version=1.13.0 fills the version variable in the main package at build time. Go also embeds the commit information by itself:
$ go version -m small
small: go1.27.4
    path    bookstore/cmd/bookstore-api
    build   -trimpath=true
    build   DefaultGODEBUG=tracebacklabels=0,x509sslcertoverrideplatform=0
    build   CGO_ENABLED=0
    build   GOARCH=amd64
    build   GOOS=linux
    build   vcs=git
    build   vcs.revision=024bd8e036f92f6dbdb8dd8ff8b5a0f40af5c514
    build   vcs.modified=true
(I show part of the output.) The DefaultGODEBUG line is the subject of post 14: because the module's go line is 1.26.0, two new behaviours of 1.27 are off in this binary. The Dockerfile has two stages:
# syntax=docker/dockerfile:1
FROM --platform=$BUILDPLATFORM golang:1.27.4 AS build
ARG TARGETOS TARGETARCH VERSION=dev
WORKDIR /src
COPY go.mod go.sum ./
RUN go mod download
COPY . .
RUN CGO_ENABLED=0 GOOS=$TARGETOS GOARCH=$TARGETARCH \
    go build -trimpath -ldflags="-s -w -X main.version=$VERSION" -o /out/bookstore-api ./cmd/bookstore-api

FROM gcr.io/distroless/static-debian13:nonroot
COPY --from=build /out/bookstore-api /bookstore-api
ENV BOOKSTORE_ADDR=:8080
EXPOSE 8080
ENTRYPOINT ["/bookstore-api"]
The Go-specific part is --platform=$BUILDPLATFORM: the build stage runs on the build machine's own architecture and cross-compiles for the target platform. Because Go cross-compiles without extra tools, no emulation is needed at all. The run stage has no shell and no package manager, and the user is not root (UID 65532). After docker buildx build --platform linux/amd64 --build-arg VERSION=1.13.0 -t goseries-bookstore-api:13 ., docker images lists the image at 4.72 MB. The details of this image (cache layers, image scanning, signing) are in the Docker series; the Kubernetes manifests are in the Kubernetes series.
Production Notes
Do not open pprof on the public port. A CPU profile burns CPU for 30 seconds, the heap and goroutine profiles expose the code's internal structure and stacks, and a trace produces a detailed dump of the runtime. A separate port, 127.0.0.1 and a port-forward when needed are enough.
Do not set GOMEMLIMIT equal to the container limit. The limit covers everything the Go runtime manages (the heap, goroutine stacks), but not the binary itself, memory allocated through cgo, or memory the operating system holds for the process. Leave some room. Set the limit too low and the GC runs all the time and eats the CPU; the runtime caps the CPU given to the GC at about 50% for that case.
Health probes end up in the log too: when Kubernetes calls /readyz every few seconds, a good share of the log becomes probe lines. Writing probe paths at Debug level, or sampling them, makes sense.
terminationGracePeriodSeconds (30 seconds by default) must be longer than DrainDelay + ShutdownTimeout; otherwise Kubernetes cuts the shutdown short with SIGKILL. In Bookstore it is 3 + 20 = 23 seconds.
Common Pitfalls
Exiting with log.Fatal. Because it calls os.Exit, defers do not run; the database pool is not closed and buffered logs are not written. Return the error from run and exit once in main.
Embedding an slog.Handler and forgetting WithAttrs. logger.With("service", "x") calls the embedded handler's WithAttrs and gets back the unwrapped inner handler; no record from that logger carries the request ID, and nothing reports an error.
Taking the return of ListenAndServe after Shutdown for the end of the program. ErrServerClosed comes back at once; if main ends right then, requests in flight are still cut. Wait for Shutdown to return.
Giving the debug server a WriteTimeout. /debug/pprof/profile runs for 30 seconds by default; if WriteTimeout is shorter, pprof rejects the request.
Expecting GOMAXPROCS to adjust without a Kubernetes CPU limit. With only a request, the runtime sees all the CPUs of the node.
A Small Experiment
★☆☆ Run the service with BOOKSTORE_LOG_FORMAT=text BOOKSTORE_LOG_LEVEL=debug and place an order. What does the same record look like as text?
★★☆ Add an option to Logging: requests to /healthz and /readyz are written at Debug level, the others at Info. Write a test for it.
★★★ Add vcs.revision and vcs.modified to the start-up log with debug.ReadBuildInfo(). Then call the leaking function from labs/08-leakprofile from a temporary endpoint and confirm that /debug/pprof/goroutineleak?debug=1 shows the leaked goroutines.
The service is now ready for production: it takes its settings from the environment, writes JSON logs, shuts down cleanly and runs in a 5 MB image. In the next post we look back at how Go changed from 1.22 to 1.27: the loop variable, ServeMux patterns, iterators, the Green Tea GC, generic methods, the move to json/v2 promised in post 10, what the DefaultGODEBUG line means, and moving code to a new release with go fix.